Criminal Immigration Prosecutions Down 14% in FY 2017
The latest available data from the U.S. Justice Department show that during FY 2017 the government reported 59,910 new immigration prosecutions. According to the case-by-case information analyzed by the Transactional Records Access Clearinghouse (TRAC) at Syracuse University, this number is down 14 percent over the past fiscal year when the number of criminal prosecutions totaled 69,636.
The number of immigration criminal prosecutions peaked in FY 2013 when almost 100,000 individuals were prosecuted. Since then they have steadily dropped. Last year's numbers were down 38.5 percent from their peak.
The long term trend in immigration prosecutions going back to FY 1997 is shown more clearly in Figure 1. The vertical bars in Figure 1 represent the number of immigration prosecutions recorded each fiscal year. Each presidential administration is distinguished by the color of the bars.
The comparisons of the number of defendants charged with immigration-related offenses are based on case-by-case information obtained by TRAC under the Freedom of Information Act from the Executive Office for United States Attorneys.
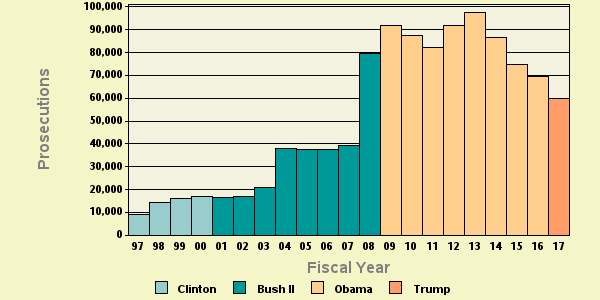
Figure 1: Criminal Immigration Prosecutions over the last 20 years
Divergent Trends by Investigative Agency
Contributing to the decline last year was a sizeable drop in the number of prosecutions resulting from referrals from Customs and Border Protection (CBP). During FY 2017, a total of 52,077 criminal prosecutions were the result of referrals from CBP. In comparison, the CBP number was 62,868 during FY 2016, and 57,748 during FY 2015. See Table 1.
In comparisons criminal prosecutions referred by Immigration and Customs Enforcement (ICE) increased slightly. However, ICE numbers pale relative to those from CBP, accounting for only about one in five of their combined totals. Thus, in terms of sheer numbers this increase from ICE was relatively small. During FY 2017 there were just 773 more ICE investigated prosecutions over levels during FY 2016. Specifically, FY 2017 criminal prosecutions referred by ICE totaled 13,534 as compared to 12,761 during FY 2016. In addition, the number during FY 2017 was still below the figure for FY 2015. See Table 1.
A number of factors contributed to these divergent trends. Perhaps the most important factor in this drop was that total apprehensions by the Border Patrol fell last year. According to the agency, CBP reported 310,531 apprehensions nationwide, as compared with 415,816 during FY 2016, and 337,117 during FY 2015[1]. However, only a relatively small proportion of CBP apprehensions each year result in a criminal prosecution. For example, compare the figure of 310,531 apprehensions in FY 2017 to the total of 52,077 actual criminal prosecutions.
According to government records, once a criminal referral is received by federal prosecutors from CBP, almost all (~99%) are prosecuted. Very few are declined. Often CBP officers serve as special assistant U.S. attorneys (SAUSAs), and actually are the ones responsible for prosecuting the case in court. However, CBP and federal prosecutors work closely together so that referrals may not be made if CBP anticipates the case would be turned down.
In contrast to trends at CBP, the slight increase in criminal prosecutions contributed by Immigration and Customs Enforcement (ICE) last year may reflect the increase in its arrests, although only a relatively small proportion ended up as criminal referrals. Specifically during FY 2017, ICE Enforcement and Removal Operations (ERO) reported that it arrested 143,470 individuals. [An additional 32,958 arrests were made by ICE's Homeland Security Investigations (HSI).] During FY 2016 ERO reported making 114,434 arrests, while arrests during FY 2015 were 125,211[2].
ICE has broad powers so while many of those arrested may ultimately be deported, a relatively small proportion are criminally prosecuted. This also means that changes in policy as to which cases are referred for criminal prosecution can easily change prosecution totals, even when apprehensions don't rise.
ICE's criminal investigators also dwarf the number at CBP. Indeed, the agency is second only to the FBI in its number of criminal investigators. It is also the case that not all ICE prosecutions are for immigration offenses. ICE is responsible for enforcing a much wider swatch of criminal statutes than the CBP. Only about 57 percent of its referrals are classified by federal prosecutors as immigration-related, as compared with 97 percent for the CBP. Thus, small shifts in the composition of ICE criminal investigations could also have influenced the relative number that were referred last year for criminal prosecution.
| Lead Investigative Agency* | Immigration Program** | |||
| Fiscal Year | ICE | CBP | Total | |
| 2006 | 13,481 | 26,918 | 40,399 | 37,529 |
| 2007 | 15,503 | 30,171 | 45,674 | 39,458 |
| 2008 | 18,286 | 68,204 | 86,490 | 79,431 |
| 2009 | 20,411 | 78,797 | 99,208 | 91,899 |
| 2010 | 21,121 | 73,742 | 94,863 | 87,375 |
| 2011 | 21,662 | 70,015 | 91,677 | 82,250 |
| 2012 | 19,043 | 64,930 | 83,973 | 91,941 |
| 2013 | 18,472 | 72,473 | 90,945 | 97,384 |
| 2014 | 15,926 | 62,750 | 78,676 | 86,574 |
| 2015 | 13,881 | 57,748 | 71,629 | 74,791 |
| 2016 | 12,761 | 62,868 | 75,629 | 69,636 |
| 2017 | 13,534 | 52,077 | 65,611 | 59,910 |
Footnotes
[1]
See https://www.ice.gov/news/releases/dhs-announces-progress-enforcing-immigration-laws-protecting-
americans
and
https://www.cbp.gov/sites/default/files/assets/documents/2016-
Oct/BP%20Total%20Monthly%20Apps%20by%20Sector%20and%20Area%2C%20FY2000-FY2016.pdf.
[2]
https://www.ice.gov/news/releases/dhs-announces-progress-enforcing-immigration-laws-protecting-americans;
https://www.ice.gov/news/releases/dhs-releases-end-fiscal-year-2016-statistics.
[3] The classification of a case under the Justice Department's "immigration" program category is a subjective judgment on the part of the assistant U.S. attorney assigned the case. Often cases could fit under one of several categories. Which is chosen can understandable be influenced by which particular program is the one that the administration is then emphasizing as a priority.
TRAC offers free monthly reports on program categories such as white collar crime, immigration, drugs, weapons and terrorism and on selected government agencies such as the IRS, FBI, ATF and DHS. For the latest information on prosecutions and convictions, go to http://trac.syr.edu/tracreports/bulletins/. In addition, subscribers to the TRACFed data service can generate custom reports for a specific agency, judicial district, program category, lead charge or judge via the TRAC Data Interpreter.