Official Corruption Prosecutions Fall to 20 Year Low
Corruption Prosecutions
| Number for FY 2015 | 505 |
|---|---|
| Percent Change from previous year | -3.6 |
| Percent Change from 5 years ago | -30.5 |
| Percent Change from 10 years ago | -23.6 |
| Percent Change from 20 years ago | -38.1 |
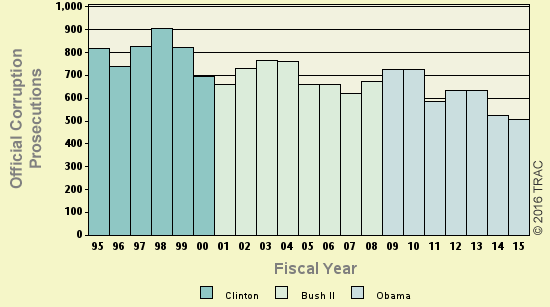
The latest available data from the Justice Department indicates that the long-term decline in federal criminal prosecutions for official corruption has continued. During FY 2015 the government reported 505 new official corruption prosecutions. Early information indicates that just 140 new corruption prosecutions have been filed during the first four months of FY 2016. According to the case-by-case information analyzed by the Transactional Records Access Clearinghouse (TRAC), the total for FY 2015 is down 3.6 percent over the previous 2014 fiscal year total of 524 such prosecutions.
The comparisons of the number of defendants charged with official corruption offenses are based on case-by-case information obtained by TRAC under the Freedom of Information Act from the Executive Office for United States Attorneys (see Table 1).
This is the lowest level for official corruption prosecutions over the past 20 years. Compared to five years ago when there were 727, the number of FY 2015 prosecutions of this type is down 30.5 percent. Prosecutions over the past year are lower than they were ten years ago. Overall, the data show that prosecutions of this type are down 23.6 percent from the level of 661 reported in 2005 and down 38.1 percent from the level of 816 reported in 1995. Also see earlier 2014 TRAC report on this trend.
The long term trend in official corruption prosecutions going back to FY 1995 is shown more clearly in Figure 1. The vertical bars in Figure 1 represent the number of official corruption prosecutions of this type recorded each fiscal year. Each presidential administration is distinguished by the color of the bars. To view trends month-by-month rather than year-by-year, see TRAC's monthly report series for the latest data.
Leading Program Categories
Within the broad category of official corruption, cases were classified by prosecutors into more specific types.
Case types within official corruption are
Corruption(Govt Off)-Fed Law Enforcement
Corruption(Govt Off)-Fed Other
Corruption(Govt Off)-Fed Procurement
Corruption(Govt Off)-Fed Program
Corruption(Govt Off)-Local
Corruption(Govt Off)-Other
Corruption(Govt Off)-State
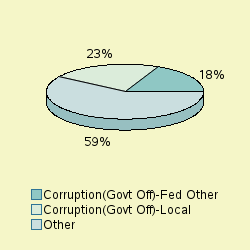
The single largest number of prosecutions of these matters through September 2015 was for "Corruption(Govt Off)-Local", accounting for 23 percent of prosecutions.
As shown in Figure 2, the second largest number of matters were prosecutions filed under the program area of "Corruption(Govt Off)-Fed Other " (18%) . The "Other" category in Figure 2 is comprised of a diverse group of programs. The largest specific programs within the "Other" category were: Corruption(Govt Off)-Fed Law Enforcement" (16.2%), "Corruption(Govt Off)-Other" (13.5%), "Corruption(Govt Off)-State" (13.5%), "Corruption(Govt Off)-Fed Program" (8.7%), "Corruption(Govt Off)-Fed Procurement" (7.1%). See Figure 2.
Leading Investigative Agencies
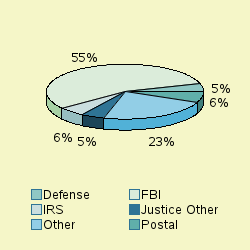
The lead investigative agency for official corruption prosecutions through September 2015 was "Justice - Federal Bureau of Investigation" accounting for 55.4 percent of prosecutions referred.
As shown in Figure 3, additional agencies with substantial numbers of official corruption referrals were: Postal Service (6.3%), "Treasury - Internal Revenue Service" (5.7%), "Defense" (4.8%), "Justice - Other" (4.8%). The "Other" category in Figure 3 is comprised of a diverse group of agencies. The agencies with substantial numbers of official corruption within the "Other" category were: Homeland Security - Immigration an" (2.4%).
Top Ranked Lead Charges
Table 2 shows the top lead charges recorded in the prosecutions of official corruption matters filed in U.S. District Court during FY 2015.
| Lead Charge | Count | Rank | 1 yr ago | 5 yrs ago | 10 yrs ago | 20 yrs ago |
|---|---|---|---|---|---|---|
| 18 USC 371 - Conspiracy to commit offense or to defraud US | 76 | 1 | 2 | 7 | 3 | 3 |
| 18 USC 666 - Theft or bribery in programs receiving Fed funds | 60 | 2 | 1 | 2 | 2 | 2 |
| 18 USC 201 - Bribery of public officials and witnesses | 57 | 3 | 3 | 1 | 1 | 1 |
| 18 USC 1951 - Hobbs Act | 47 | 4 | 6 | 3 | 5 | 4 |
| 18 USC 1343 - Fraud by wire, radio, or television | 37 | 5 | 9 | 11 | 9 | 18 |
| 18 USC 1341 - Mail Fraud - Frauds and swindles | 32 | 6 | 5 | 9 | 4 | 6 |
| 18 USC 641 - Public money, property or records | 28 | 7 | 4 | 6 | 6 | 5 |
| 21 USC 846 - Attempt and conspiracy | 22 | 8 | 14 | 12 | 11 | 82 |
| 18 USC 1028 - Fraud and related activity - id documents | 11 | 9 | 16 | 23 | 18 | 51 |
| 18 USC 1709 - Theft of mail matter by officer or employee | 10 | 10 | 11 | 4 | 18 | 8 |
"Conspiracy to commit offense or to defraud US" (Title 18 U.S.C Section 371) was the most frequent recorded lead charge. Title 18 U.S.C Section 371 was ranked second a year ago, while it was the seventh most frequently invoked five years ago. It was ranked third ten years ago and third twenty years ago.
Ranked second in frequency was the lead charge "Theft or bribery in programs receiving Fed funds" under Title 18 U.S.C Section 666. Title 18 U.S.C Section 666 was ranked first a year ago, while it was the second most frequently invoked five years ago. It was ranked second ten years ago and second twenty years ago.
Ranked third was "Bribery of public officials and witnesses" under Title 18 U.S.C Section 201. Title 18 U.S.C Section 201 was ranked third a year ago, while it was the first most frequently invoked five years ago. It was ranked first ten years ago and first twenty years ago.
Among these top ten lead charges, the one showing the greatest increase in prosecutions — up 267 percent — compared to one year ago was Title 21 U.S.C Section 846 that involves "Attempt and conspiracy". This was the same statute that had the largest increase — 118 percent — when compared with five years ago.
Again among the top ten lead charges, the one showing the sharpest decline in prosecutions compared to one year ago — down 48.3 percent — was "Theft or bribery in programs receiving Fed funds" (Title 18 U.S.C Section 666). This was the same statute that had the largest decrease — 80.0 percent — when compared with five years ago.
Top Ranked Judicial Districts
During FY 2014 the Justice Department said the government obtained 1.64 official corruption prosecutions for every one million people in the United States. Official corruption prosecutions for one million people in the United States during FY 2015 were 1.58. Understandably, there is great variation in the per capita number of official corruption prosecutions in each of the nation's ninety-four federal judicial districts
| Judicial District | Percapita | Count | Rank | 1yr ago | 5yrs ago | 10yrs ago | 20yrs ago |
|---|---|---|---|---|---|---|---|
| Montana | 11 | 11 | 1 | 1 | 4 | 5 | 4 |
| D. C. | 9 | 6 | 2 | 2 | 1 | 1 | 1 |
| N Car, E | 6 | 24 | 3 | 45 | 42 | 63 | 72 |
| Alaska | 6 | 4 | 4 | 78 | 79 | 80 | 15 |
| La, M | 5 | 4 | 5 | 10 | 3 | 24 | 47 |
| Ala, S | 5 | 4 | 6 | 78 | 79 | 27 | 82 |
| Ala, M | 4 | 5 | 7 | 48 | 79 | 39 | 63 |
| Ga, N | 4 | 28 | 8 | 27 | 54 | 26 | 40 |
| Miss, S | 4 | 8 | 9 | 3 | 6 | 44 | 57 |
| La, E | 4 | 7 | 10 | 8 | 11 | 11 | 27 |
The District of Montana — with 10.75 prosecutions as compared with 1.6 prosecutions per one million people in the United States — was the most active through September 2015. The District of Montana was ranked first a year ago, while it was ranked fourth five years ago. The district's position ten years ago was fifth and fourth twenty years ago.
The District of Washington, D.C. (Washington) ranked second. The District of Washington, D.C. (Washington) was ranked second a year ago, while it was ranked first five years ago. The district's position ten years ago was first as well as twenty years ago.
Sharing third place were the Eastern District of North Carolina (Raleigh) and Alaska (Anchorage).
The federal judicial district which showed the greatest growth in the rate of official corruption prosecutions compared to one year ago — 501 percent — was the Eastern District of North Carolina (Raleigh). Compared to five years ago, the district with the largest growth — 342 percent — was the Northern District of Georgia (Atlanta).
In the last year, the judicial District Court recording the largest drop in the rate of official corruption prosecutions — 66.7 percent — was Montana.Ā
TRAC offers free monthly reports on program categories such as white collar crime, immigration, drugs, weapons and terrorism and on selected government agencies such as the IRS, FBI, ATF and DHS. For the latest information on prosecutions and convictions, go to http://trac.syr.edu/tracreports/bulletins/. In addition, subscribers to the TRACFed data service can generate custom reports for a specific agency, judicial district, program category, lead charge or judge via the TRAC Data Interpreter.