Fraud Prosecutions
| Number Year-to-date | 1,235 |
|---|---|
| Percent Change from previous year | 68.9 |
| Percent Change from 5 years ago | 134 |
| Percent Change from 10 years ago | 95.7 |
| Percent Change from 20 years ago | 740 |
Numbers were pushed higher in part by the volume of activity in Puerto Rico, where assistant U.S. attorneys charged 548 defendants with health care fraud in FY 2011. Even if the unusually active record of prosecutors in Puerto Rico was set aside, health care fraud prosecutions nationally would still have reached their highest level in over a decade. The Southern District of Florida (Miami) led the nation in activity, accounting for nearly one out of every nine health care fraud prosecutions, followed by the Southern District of Texas (Houston). Together, these two districts accounted for over one out of every five health care fraud prosecutions.
The comparisons of the number of defendants charged with health care fraud offenses are based on case-by-case information obtained by the Transactional Records Access Clearinghouse (TRAC) under the Freedom of Information Act from the Executive Office for United States Attorneys.
The long term trend in health care fraud prosecutions going back twenty years is shown more clearly in Figure 1. The vertical bars in Figure 1 represent the number health care fraud prosecutions of this type recorded each fiscal year. Each presidential administration is distinguished by the color of the bars. To view trends month-by-month rather than year-by-year, see TRAC's monthly report series for the latest data.
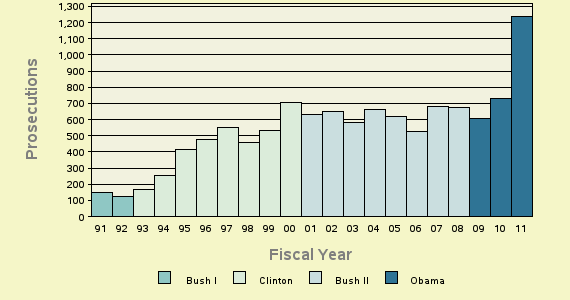
Figure 1: Criminal Health Care Fraud Prosecutions over the last 20 years
Top Ranked Judicial Districts — Health Care Fraud Prosecutions
The Justice Department data show that during FY 2011, the government obtained 4.0 federal health care fraud prosecutions for every one million persons, setting aside districts outside the 50 states. Of these 90 districts, all but 18 prosecuted one or more cases involving health care fraud last year.
But rates varied widely. Florida South (Miami) not only had the highest number of prosecutions (141), but relative to its population it also had the highest rate of health care prosecutions of any district. Prosecutions there were more than five times the level in the country as a whole. While prosecutions in the Southern District of Alabama (Mobile) were fewer in absolute numbers, relative to its population size that district ranked second, with over three times the prosecution rate of the country as a whole. Coming in third was the Southern District of Texas (Houston), with just under three times the average rate of prosecutions found in the U.S. Table 2 lists the top ten districts ranked by the number of health care fraud prosecutions last year, relative to their individual population sizes.
Criminal Prosecutions (relative to population size)
| Rank | Judicial District | Number | Number Per Million Population | ||
|---|---|---|---|---|---|
| Prosecutions | Turndowns* | Prosecutions | Turndowns* | ||
| 1 | Fla, S** | 141 | 71 | 21.1 | 10.7 |
| 2 | Ala, S** | 12 | 7 | 14.5 | 8.5 |
| 3 | Texas, S | 95 | 12 | 11.3 | 1.4 |
| 4 | Mich, E | 56 | 8 | 8.5 | 1.2 |
| 5 | N. Y., S | 33 | 6 | 6.4 | 1.2 |
| 6 | Ga, M | 9 | 2 | 4.5 | 1.0 |
| 7 | N Car, W | 13 | 1 | 4.4 | 0.3 |
| 8 | W Virg, S | 4 | 1 | 4.3 | 1.1 |
| 8 | Kansas | 12 | 15 | 4.3 | 5.3 |
| 10 | N. Y., E | 33 | 13 | 4.0 | 1.6 |
Top Ranked Judicial Districts — Health Care Fraud Cases Turned Down
Despite the high numbers of federal prosecutions last year, not all referrals received by federal prosecutors from investigative agencies resulted in prosecutions. After reviewing the case, federal prosecutors sometimes decided to close the referral and not prosecute. Individual U.S. Attorneys and the assistant U.S. attorneys in each office varied in their turndown rates. At one extreme, federal prosecutors in Puerto Rico filed criminal charges against all but 6 defendants in the 554 health care fraud referrals they received. In the country as a whole, roughly four out of every ten defendants facing potential criminal charges for health care fraud were not prosecuted by the federal government.
This meant that in FY 2011, health care fraud cases involving 784 defendants that were referred to U.S. Attorneys by investigative agencies were ultimately closed without criminal charges being filed. The leading reason federal prosecutors gave last year for deciding to not file criminal charges was "lack of evidence of criminal intent." This was the reason given on 264 turndowns. The next most common reason (with 167 turndowns) was "weak or insufficient admissible evidence." But many other reasons were used for declining to file charges. For example, some cases were turned down because of "lack of investigative resources" (49) or "lack of prosecutive resources" (17), or because there was "minimal federal interest" (21).
Clearly, turndowns may reflect a variety of reasons, including the quality of the referrals received from investigative agencies in a U.S. attorney's district, the office's priorities, and the importance ascribed to health care fraud relative to other types of criminal offenses in that district.
Districts varied sharply in the number of health care fraud referrals, relative to population size, that were closed without criminal charges being filed. For the country as a whole, the turndown rate was 2.6 per million population. The District of Columbia U.S. Attorney's office led the nation in the number, relative to its population size, of health care fraud defendants against whom it decided not to file criminal charges. Of 27 potential defendants referred by investigative agencies, D.C. federal prosecutors turned down 25. Relative to population size, this was a turndown volume sixteen times higher than the national average.
Ranking second in the country on turndowns relative to its population size was the Eastern District of Arkansas (Little Rock) which had a turndown volume nearly nine times the national average (a total of 36 out of the 41 health care fraud referrals received by that office were closed without any criminal charges being filed). Maine was third in the nation relative to its population size for the number of health care fraud referrals the U.S. Attorney office there closed without filing criminal charges (a total of 15 out of 19 referrals in Maine were closed without criminal charges being filed). Table 3 lists the top ten districts ranked by the number of health care fraud turndowns last year, relative to their individual population sizes.
Two districts — Florida South (Miami) and Alabama South (Mobile) — stand out for making the top 10 rankings on both lists. Relative to their respective population sizes, they received a high volume of health care referrals and while they prosecuted many, they were also selective in which cases charges were filed in, turning many away.
Cases Turned Down (relative to population size)
| Rank | Judicial District | Number | Number Per Million Population | ||
|---|---|---|---|---|---|
| Prosecutions | Turndowns* | Prosecutions | Turndowns* | ||
| 1 | D. C. | 2 | 25 | 3.3 | 41.7 |
| 2 | Ark, E | 5 | 36 | 3.1 | 22.6 |
| 3 | Maine | 4 | 15 | 3.0 | 11.4 |
| 4 | Fla, S** | 141 | 71 | 21.1 | 10.7 |
| 5 | La, M | 1 | 7 | 1.3 | 8.9 |
| 6 | Ala, S** | 12 | 7 | 14.5 | 8.5 |
| 7 | Montana | 0 | 8 | 0.0 | 8.2 |
| 8 | R. I. | 3 | 8 | 2.9 | 7.6 |
| 9 | Ken, W | 5 | 14 | 2.3 | 6.5 |
| 10 | Ga, S | 2 | 9 | 1.4 | 6.2 |
Top Ranked Lead Charges
Table 4 shows the top lead charges recorded in the prosecution of health care fraud matters filed in federal district court during FY 2011.
| Lead Charge | Count | Rank | 1 yr ago | 5 yrs ago | 10 yrs ago | 20 yrs ago | |
|---|---|---|---|---|---|---|---|
| 18 USC 1349 - Mail Fraud - Attempt and Conspiracy | 372 | 1 | 3 | 6 | - | - | More |
| 18 USC 1347 - Health Care Fraud | 345 | 2 | 1 | 1 | 1 | - | More |
| 18 USC 1341 - Mail Fraud - Frauds and swindles | 213 | 3 | 2 | 5 | 2 | 1 | More |
| 18 USC 1033 - Insurance Fraud | 68 | 4 | 38 | - | 25 | - | More |
| 18 USC 1343 - Fraud by wire, radio, or television | 33 | 5 | 22 | 9 | 12 | 9 | More |
| 21 USC 846 - Attempt and conspiracy | 29 | 6 | 19 | 29 | 12 | - | More |
| 18 USC 1344 - Bank Fraud | 28 | 7 | 22 | 38 | 20 | 9 | More |
| 18 USC 371 - Conspiracy to commit offense or to defraud US | 22 | 8 | 6 | 2 | 3 | 3 | More |
| 42 USC 1320a-7 - Exclusion of certain individuals and entities from participation in Medicare and State health care programs | 21 | 9 | 8 | 38 | - | - | More |
| 21 USC 331 - Fed Food, Drug & Cosmetics Act - Prohibited acts | 14 | 10 | 5 | 3 | 6 | - | More |
"Mail Fraud - Attempt and Conspiracy" (Title 18 U.S.C Section 1349) was the most frequently recorded lead charge. Title 18 U.S.C Section 1349 was ranked 3rd a year ago, while it was the 6th most frequently invoked five years ago.
Ranked 2nd in frequency was the lead charge "Health Care Fraud" under Title 18 U.S.C Section 1347. Title 18 U.S.C Section 1347 was ranked 1st a year ago, while it was the 1st most frequently invoked five years ago. It was ranked 1st ten years ago.
Ranked 3rd was "Mail Fraud - Frauds and swindles" under Title 18 U.S.C Section 1341. Title 18 U.S.C Section 1341 was ranked 2nd a year ago, while it was the 5th most frequently invoked five years ago. It was ranked 2nd ten years ago and 1st twenty years ago.