Convictions for February 2024
Referring Agency: Alcohol, Tobacco, Firearms and Explosives
The latest available data from the Justice Department show that during February 2024 the government reported 751 new convictions for these matters. Those cases were referred by the Alcohol, Tobacco, Firearms and Explosives. According to the case-by-case information analyzed by the Transactional Records Access Clearinghouse (TRAC), this number is up 15.9 percent over the previous month.
The comparisons of the number of defendants convicted are based on case-by-case information obtained by TRAC under the Freedom of Information Act from the Executive Office for United States Attorneys (see Table 1).
When monthly 2024 convictions of this type are compared with those of the same period in the previous year, the number of convictions was up (2.2%). Convictions over the past year are still much higher than they were five years ago. Overall, the data show that convictions of this type are up 12.9 percent from levels reported in 2019.
Figure 1. Monthly Trends in Convictions
The increase from the levels five years ago in convictions for these matters is shown more clearly in Figure 1. The vertical bars in Figure 1 represent the number of convictions of this type recorded on a month-to-month basis. Where a prosecution was initially filed in U.S. Magistrate Court and then transferred to the U.S. District Court, the magistrate filing date was used since this provides an earlier indicator of actual trends. The superimposed line on the bars plots the six-month moving average so that natural fluctuations are smoothed out. The one and five-year rates of change in Table 1 and in the sections that follow are all based upon this six-month moving average. To view trends year-by-year rather than month-by-month, see TRAC's annual report series for a broader picture.
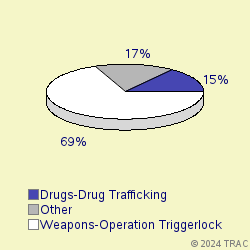
Cases were classified by prosecutors into more specific types.
The largest number of convictions of these matters in February 2024 was for "Weapons-Operation Triggerlock Major", accounting for 68.8 percent of convictions. Convictions were also filed for "Drugs-Drug Trafficking" (14.6%), "Drugs-Organized Crime Task Force" (5.6%), "Violence-Other" (3.9%), "Withheld by Govt from TRAC (FOIA challen" (3.5%). See Figure 2.
Convictions in U.S. Magistrate Courts
Top Ranked Lead Charges
In February 2024, no defendants in cases for these matters were convicted in U.S. Magistrate Courts. These courts handle less serious misdemeanor cases, including what are called "petty offenses." In addition, complaints are sometimes filed in the magistrate courts before an indictment or information is entered. In these cases, the matter starts in the magistrate courts and later moves to the district court where subsequent proceedings take place.
Convictions in U.S. District Courts
In February 2024, 751 defendants in new cases for these matters were charged in the U.S. District Courts. In addition during February there were an additional 0 defendants whose cases moved from the magistrate courts to the U.S. district courts after an indictment or information was filed. The sections which follow cover both sets of cases and therefore cover all matters filed in district court during February.
Top Ranked Lead Charges
Table 2 shows the top lead charges recorded in the convictions of matters filed in U.S. District Court during February 2024 referred by the Alcohol, Tobacco, Firearms and Explosives.
Lead Charge Count Rank 1yr ago 5yrs ago 18 USC 922 - Firearms; Unlawful acts 481 1 1 1 More 21 USC 841 - Drug Abuse Prevention & Control-Prohibited acts A 100 2 2 2 More 18 USC 1951 - Hobbs Act 22 4 6 5 More 21 USC 846 - Attempt and conspiracy 20 5 3 3 More 18 USC 371 - Conspiracy to commit offense or to defraud US 14 6 10 10 More 18 USC 924 - Firearms; Penalties 14 6 5 4 More 26 USC 5861 - Tax on Making Firearms - Prohibited acts 14 6 7 6 More 18 USC 2119 - Carjacking 11 9 9 11 More 18 USC 844 - Explosives - Importation and storage of explosives 4 10 8 8 More Table 2. Top Charges for Convictions
"Firearms; Unlawful acts" (Title 18 U.S.C Section 922) was the most frequent recorded lead charge. "Firearms; Unlawful acts" (Title 18 U.S.C Section 922) was ranked 1 a year ago, while it was ranked 1 five years ago.
Ranked 2nd in frequency was the lead charge "Drug Abuse Prevention & Control-Prohibited acts A" under Title 21 U.S.C Section 841. "Drug Abuse Prevention & Control-Prohibited acts A" under Title 21 U.S.C Section 841 was ranked 2 a year ago, while it was ranked 2 five years ago.
Ranked 3rd was "Other US Code Section" under Title U.S.C Section. "Other US Code Section" under Title U.S.C Section was ranked 4 a year ago, while it was ranked 7 five years ago.
Among these top ten lead charges, the one showing the greatest increase in convictions — up 77.4 percent — compared to one year ago was Title 18 U.S.C Section 371 that involves " Conspiracy to commit offense or to defraud US ". This was the same statute that had the largest increase — 358.3 % — when compared with five years ago.
Again among the top ten lead charges, the one showing the sharpest decline in convictions compared to one year ago — down 43.6 percent — was " Explosives - Importation and storage of explosives " (Title 18 U.S.C Section 844 ). Compared to five years ago, the most significant decline in convictions — 31.4 percent — was for convictions where the lead charge was " Attempt and conspiracy " (Title 21 U.S.C Section 846 ).
Top Ranked Judicial Districts
In February 2024 the Justice Department's case-by-case records show that the government obtained 270.4 convictions for every ten million people in the United States.
Understandably, there is great variation in the per capita number of convictions in each of the nation's ninety-four federal judicial districts.
The districts registering the largest number of convictions per capita for these matters last month are shown in Table 3. Districts must have at least 5 convictions to receive a ranking.
Judicial District Percapita Count Rank 1yr ago 5yrs ago Montana 2,137 20 1 34 31 More Delaware 1,885 16 2 73 83 More Okla, E 1,624 10 3 85 66 More W Virg, N 1,558 12 4 16 41 More Ark, E 1,172 16 5 19 33 More Alaska 1,025 6 6 52 47 More Ala, M 907 9 7 42 37 More Mo, E 906 22 8 10 17 More Mo, W 882 24 9 13 13 More Ala, S 834 6 10 30 41 More Table 3. Top 10 Districts (per ten million people)
The District of Montana — with 2137 convictions as compared with 270.4 convictions per ten million population in the United States — was the most active during February 2024.
The District of Delaware ranked 2nd.
Eastern District of Oklahoma (Muskogee) is now ranking 3rd.
Recent entrants to the top 10 list were Western District of Missouri (Kansas City), now ranked 9th , and Northern District of West Virginia (Wheeling) at 4th In the same order, these districts ranked 13th and 16th one year ago and 13th and 41st five years ago.
The federal judicial district which showed the greatest growth in the rate of convictions compared to one year ago — 333.3 percent — was Eastern District of Oklahoma (Muskogee). Compared to five years ago, the district with the largest growth — 128.2 percent — was Eastern District of Arkansas (Little Rock).
In the last year, the judicial District Court recording the largest drop in the rate of convictions — 34 percent — was Southern District of Alabama (Mobile). But over the past five years, Alaska showed the largest drop — 3.7 percent.
Top Ranked District Judges
At any one time, there are about 680 federal District Court judges working in the United States. The judges recorded with the largest number of new crime cases resulting in convictions of this type during February 2024 are shown in Table 4.
Judge Count Rank Watters, Susan Pamela Montana 12 1 More Connolly, Colm Felix Delaware 9 2 More Crone, Marcia A. Texas, E 9 2 More Urbanski, Michael Francis Virg, W 9 2 More Rosenberg, Robin Lee Fla, S 8 5 More Morris, Brian Matthew Montana 8 5 More O'Connor, Reed Charles Texas, N 8 5 More Goldsmith, Mark Allan Mich, E 7 8 More Sachs, Howard Frederic Mo, W 7 8 More Kays, David Gregory Mo, W 7 8 More Boyle, Terrence William N Car, E 7 8 More Delgado Hernandez, Pedro Alberto Puer Rico 7 8 More Pittman, Mark Timothy Texas, N 7 8 More Table 4. Top Ten Judges
A total of 5 out of the "top ten" judges were in districts which were in the top ten with the largest number of convictions per capita, while the remaining 8 judges were from other districts. (Because of ties, there were a total of 13 judges in the "top ten" rankings.)
Judge Susan Pamela Watters in the District of Montana ranked 1st with 12 convicted in convictions.
Judges Colm Felix Connolly in the District of Delaware, Marcia A. Crone in the Eastern District of Texas (Tyler) and Michael Francis Urbanski in the Western District of Virginia (Roanoke) ranked 2nd with 9 convicted in convictions.
Report Generated: April 3, 2024