Modest Increase in Official Corruption Convictions in 2023
Published Jan 31, 2024
The latest fiscal yearend data from the Justice Department show that during FY 2023 the federal government reported 334 new official corruption convictions. According to the case-by-case information analyzed by the Transactional Records Access Clearinghouse (TRAC), this number is up 2.5 percent over the previous fiscal year when the number of convictions totaled 326.
According to these government records, the single largest number of convictions during FY 2023 were of local government officials for official corruption offenses. These accounted for about one in four (24%) of these convictions or 80 in total. In comparison convictions of state officials for these types of crimes were half that number – about one in eight of these convictions or 41.
For corruption involving federal matters, there were 44 convictions for official corruption involving federal law enforcement officials. Among others where federal prosecutors provided specific labels were official corruption for federal procurement (30) and in federal programs (26). The remainder were not further classified but were simply grouped as “Other.”
Lengthy Investigations Often Involved for Corruption Cases
The Federal Bureau of Investigation was credited as the lead investigative agency in six out of ten or 200 of these cases. The Postal Service had the next highest number accounting for just 20 cases, and the Defense Department was credited with 14 cases. The rest were spread across a large number of other federal agencies each typically responsible for a few cases each.
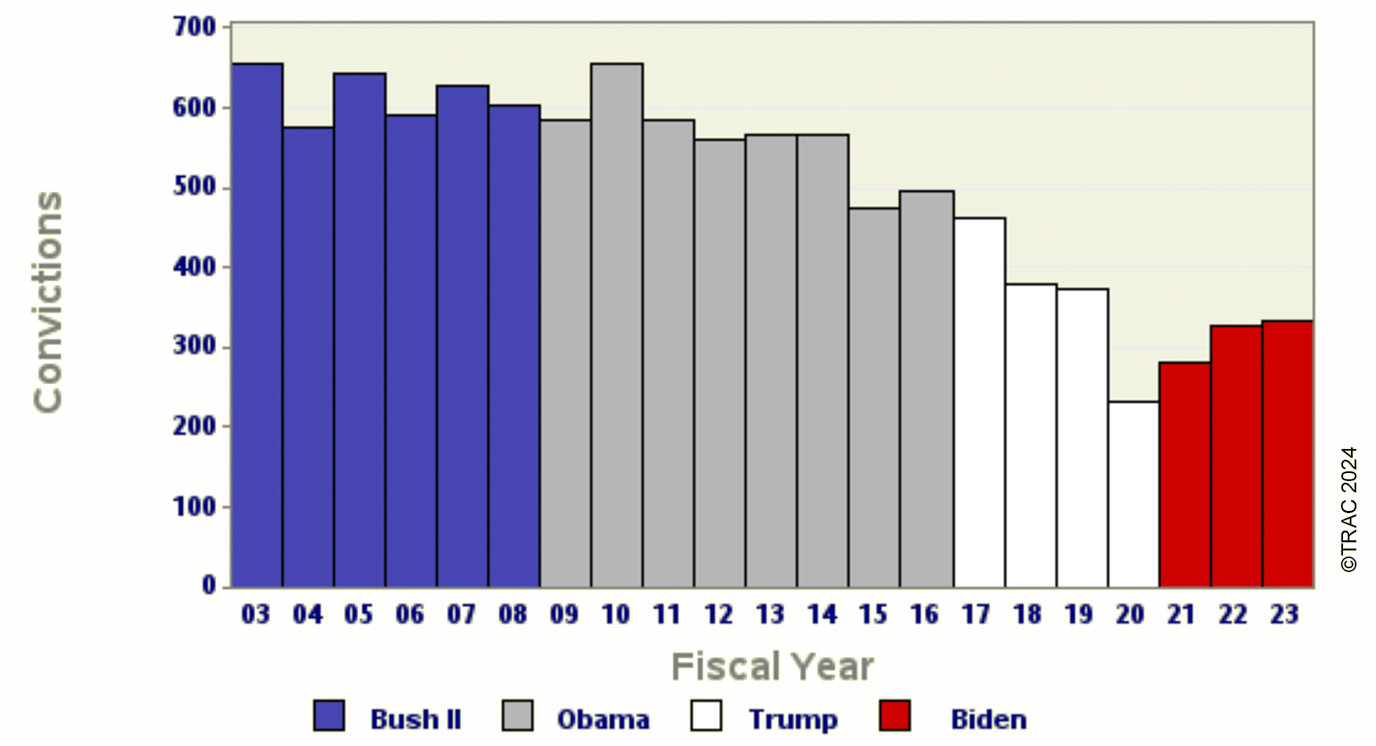
Official corruption cases often take years to develop even after a referral is received from an investigative agency. Defendants convicted during FY 2023 had been referred to federal prosecutors on average 1,062 days prior to their eventual conviction and sentencing – or some three years earlier. As TRAC earlier reported, federal enforcement of all types fell sharply in FY 2020 with the COVID-19 government shutdowns. Convictions for official corruption offenses have been climbing out of this hole slowly since then.
The long-term trend in official corruption convictions for these matters going back to FY 2003 is shown more clearly in Figure 1. The vertical bars in Figure 1 represent the number of official corruption convictions of this type recorded each fiscal year. Each presidential administration is distinguished by the color of the bars. The comparisons of the number of defendants convicted for official corruption offenses are based on case-by-case information obtained by TRAC after successful litigation under the Freedom of Information Act.
Top Ranked Lead Charge
"Theft or bribery in programs receiving federal funds" (Title 18 U.S.C Section 666) was the most frequently recorded lead charge. This has consistently been the most frequently invoked lead charge over the past 20 years, ranking first a year ago, five years ago, ten years ago, and second only to the Hobbs Act (18 U.S.C. 1951) twenty years ago. Title 18 U.S.C Section 666 forms the basis for a large number of prosecutions of local and state officials.
Ranked second in frequency was the lead charge "Bribery of public officials and witnesses" under Title 18 U.S.C Section 201. This statute generally ranks near the top in use. It was ranked third a year ago, while it was the second most frequently invoked five years ago. It was ranked fourth ten years ago and third twenty years ago. This charge figures prominently in the prosecution of many law enforcement officials.
"Fraud by wire, radio, or television" under Title 18 U.S.C Section 1343 was the third most frequently used for these convictions and is used across a wide range of official corruption case types. This was ranked second in FY 2022, while it was the sixth most frequently invoked five years ago. Its use was less common ten and twenty years ago.
The remaining statutes in the top ten are shown below in Table 1.
| Lead Charge | Count | Rank | 1 yr ago | 5 yrs ago | 10 yrs ago | 20 yrs ago |
|---|---|---|---|---|---|---|
| 18 USC 666 - Theft or bribery in programs receiving Fed funds | 77 | 1 | 1 | 1 | 1 | 2 |
| 18 USC 201 - Bribery of public officials and witnesses | 39 | 2 | 3 | 2 | 4 | 3 |
| 18 USC 1343 - Fraud by wire, radio, or television | 32 | 3 | 2 | 6 | 9 | 17 |
| 18 USC 371 - Conspiracy to commit offense or to defraud US | 30 | 4 | 4 | 3 | 3 | 5 |
| 18 USC 641 - Public money, property or records | 19 | 5 | 7 | 4 | 5 | 4 |
| 18 USC 1951 - Hobbs Act | 17 | 6 | 8 | 5 | 2 | 1 |
| 18 USC 1709 - Theft of mail matter by officer or employee | 9 | 7 | 11 | 7 | 7 | 10 |
| Other US Code Section | 9 | 7 | 9 | 22 | 12 | 18 |
| 18 USC 922 - Firearms; Unlawful acts | 7 | 9 | 15 | 52 | 20 | 31 |
| 21 USC 841 - Drug Abuse Prevention & Control-Prohibited acts A | 7 | 9 | 23 | 13 | 20 | 42 |
Top Ranked Judicial Districts by Corruption Convictions Per Capita
During FY 2022 and FY 2023, the Justice Department said the government obtained about one (1) official corruption convictions for every one million people in the United States. Understandably, there is great variation in the per capita number of official corruption convictions in each of the nation’s ninety-four federal judicial districts.
The nation’s capital generally leads the nation in the per capita rate of convictions for official corruption with 25 times the national rate in FY 2023. However, in terms of number of convictions, it didn’t rank first.
The Southern District of New York (Manhattan) had more individuals convicted: twenty-four (24) compared to D.C.’s seventeen (17) during FY 2023. For corruption convictions relative to population, the Southern District of New York fell to third place – tied with the Southern District of Mississippi (Jackson) – also with five times the national rate.
Alaska was in second place with seven times the number of convictions as the national rate, while Hawaii and North Dakota tied for fifth place, each with four times the national rate.
The other federal judicial districts in the top ten are shown in Table 2.
| Judicial District | Percapita | Count | Rank | 1 yr ago | 5 yrs ago | 10 yrs ago | 20 yrs ago |
|---|---|---|---|---|---|---|---|
| D. C. | 25 | 17 | 1 | 2 | 1 | 1 | 1 |
| Alaska | 7 | 5 | 2 | 3 | 70 | 26 | 4 |
| Miss, S | 5 | 9 | 3 | 12 | 18 | 6 | 17 |
| N. Y., S | 5 | 24 | 4 | 14 | 31 | 55 | 12 |
| Hawaii | 4 | 6 | 5 | 13 | 54 | 75 | 56 |
| N Dakota | 4 | 3 | 6 | 66 | - | 46 | 2 |
| La, E | 4 | 6 | 7 | 1 | 5 | 3 | 5 |
| Mo, E | 3 | 9 | 8 | 30 | 29 | 34 | 50 |
| N Car, E | 3 | 12 | 9 | 20 | 33 | 17 | 73 |
| N Mexico | 3 | 6 | 10 | 50 | 70 | 8 | 63 |