A Ten-Year Look at Inadmissible Migrants and Paroled Migrants at Ports of Entry
Published Jan 12, 2024
When noncitizens arrive at a port of entry, either along the border or at an international airport, border officials must assess whether each person can show that they are allowed to enter the United States (i.e., whether they are admissible) or whether they are not admissible (i.e., inadmissible[1]). When a border agent decides that someone is not admissible, it does not necessarily mean that a person has a criminal background or is a public safety risk; rather, it often means that the individual simply does not have a current visa or other documents that meet the standard to make them admissible. However, even if a border agent finds that a person is not admissible, there are provisions in the law that may allow that person to physically enter the country. One of these provisions, parole, allows the government to permit noncitizens to enter the country lawfully on a temporary basis and potentially receive work authorization.[2]
This report seeks to answer the question of how frequently in recent years Customs and Border Protection (CBP) encountered noncitizens at ports of entry of who are not admissible, as well as the question of how many of these “inadmissibles” are ultimately recorded as having been paroled into the country. This question is relevant since one—recently growing—application of the parole authority is to allow immigrants to enter the country to seek asylum or for other humanitarian reasons. Although this report focuses only on those cases where CBP recorded parole as the final disposition, other dispositions such as issuing a Notice to Appear or referring a person for a credible fear interview may also allow a noncitizen to seek asylum.[3] These data can be explored on TRAC’s Inadmissibles tool online.
According to data obtained from Customs and Border Protection through TRAC’s Freedom of Information Act requests and then analyzed by the Clearinghouse, the number of inadmissible immigrants arriving at ports of entry has increased substantially in recent years, as has the percent of those inadmissibles that have been allowed into the country under the parole authority.[4] See Figure 1 and Table 1 below.[5]
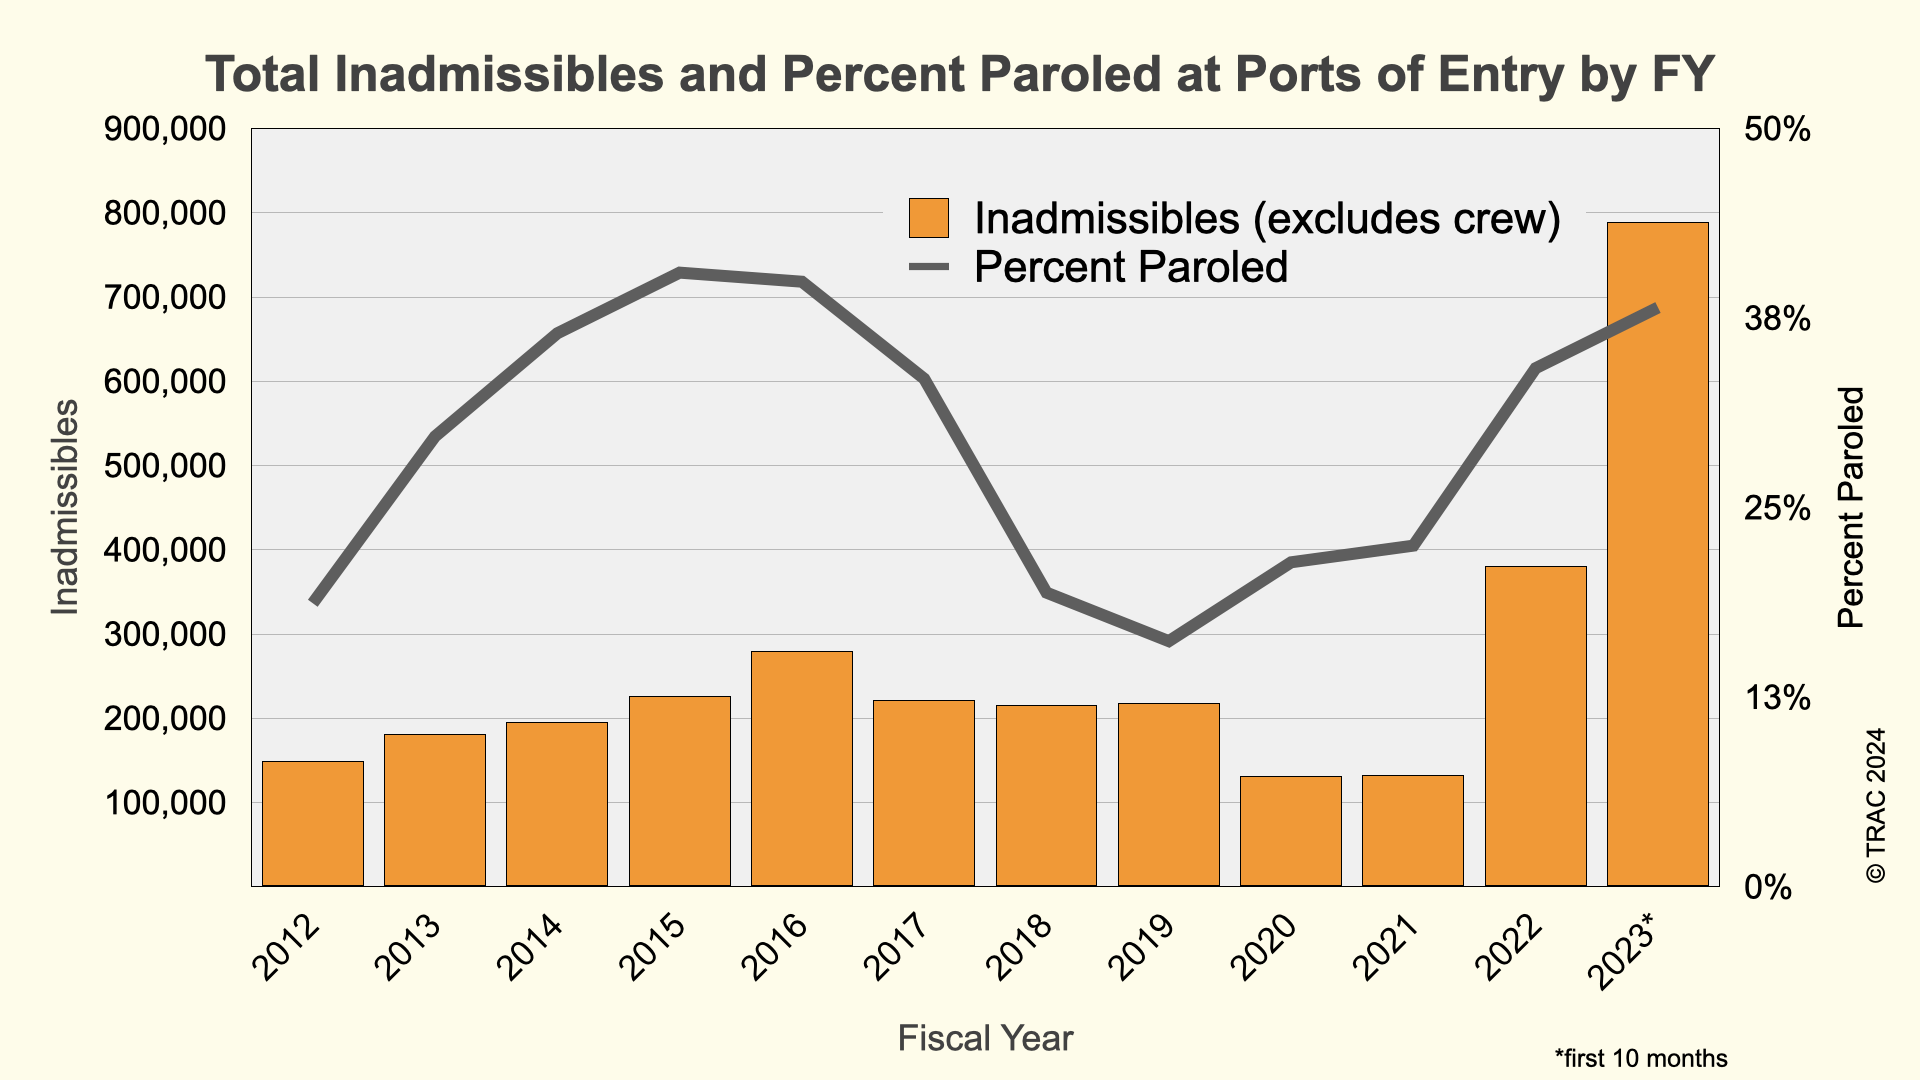
Among all inadmissibles, paroled migrants accounted for the largest increase in recent years, increasing nearly four-fold from around 35,314 in FY 2019 to 130,016 in FY 2022. These numbers increased again to 301,069 in the first ten months of FY 2023. Between FY 2012 and FY 2022, the largest percentage of inadmissible immigrants recorded as paroled into the country at a port of entry occurred in FY 2015 at 40.5 percent. Overall, 31.9 percent of inadmissibles have been paroled since FY 2012, including 22.8 percent during the Trump administration. In FY 2022, however, that number increased to 34.2 percent and in FY 2023, that number increased again to 38.2 percent, although this is not at an historical high. Thus, in the past two years, ports of entry have seen larger numbers of inadmissible migrants arriving at ports, and more of those migrants have been paroled into the country both in total numbers and as a fraction of all inadmissibles. Despite the growth in inadmissibles and people paroled, these numbers still make up a very small fraction – less than one-tenth of one percent -- of the millions of people that currently arrive at ports of entry. In FY 2023, for instance, the Office of Field Operations reported 363.2 million arrivals for the year with an average of 30 million arrivals per month.[6]
Increases in the number of paroled migrants coincides with humanitarian parole programs for Cubans, Haitians, Nicaraguans, Venezuelans, and Ukrainians, as well as the use of CBP One to schedule appointments at ports of entry along the U.S.-Mexico border for asylum seekers. As detailed in a previous TRAC report, if a person is inadmissible and they do not qualify for one of the visa waiver or parole categories, that person is typically not allowed entry into the United States.
| Fiscal Year | Inadmissibles | Paroled | Percent Paroled |
|---|---|---|---|
| 2012 | 148,820 | 27,800 | 18.7% |
| 2013 | 181,144 | 53,869 | 29.7% |
| 2014 | 195,498 | 71,340 | 36.5% |
| 2015 | 226,724 | 91,715 | 40.5% |
| 2016 | 279,905 | 111,675 | 39.9% |
| 2017 | 222,039 | 74,481 | 33.5% |
| 2018 | 216,137 | 41,856 | 19.4% |
| 2019 | 217,857 | 35,314 | 16.2% |
| 2020 | 131,410 | 28,076 | 21.4% |
| 2021 | 132,284 | 29,732 | 22.5% |
| 2022 | 380,652 | 130,016 | 34.2% |
| 2023* | 788,953 | 301,069 | 38.2% |
Overall Inadmissibles by Port of Entry
The number of inadmissibles encountered vary significantly across the Custom and Border Protection’s 300 ports of entry in the United States. The most common ports of entry for inadmissibles have changed over time. Contrary to popular understanding, ports of entry that receive inadmissible migrants are not necessarily located along the U.S.-Mexico border. For instance, in FY 2023, Office of Field Operations officials at U.S. ports of entry recorded the most inadmissibles (94,852) at Miami International Airport, Florida, followed by San Ysidro, California (78,781), and Brownsville, Texas (75,230). See Table 2.[7]
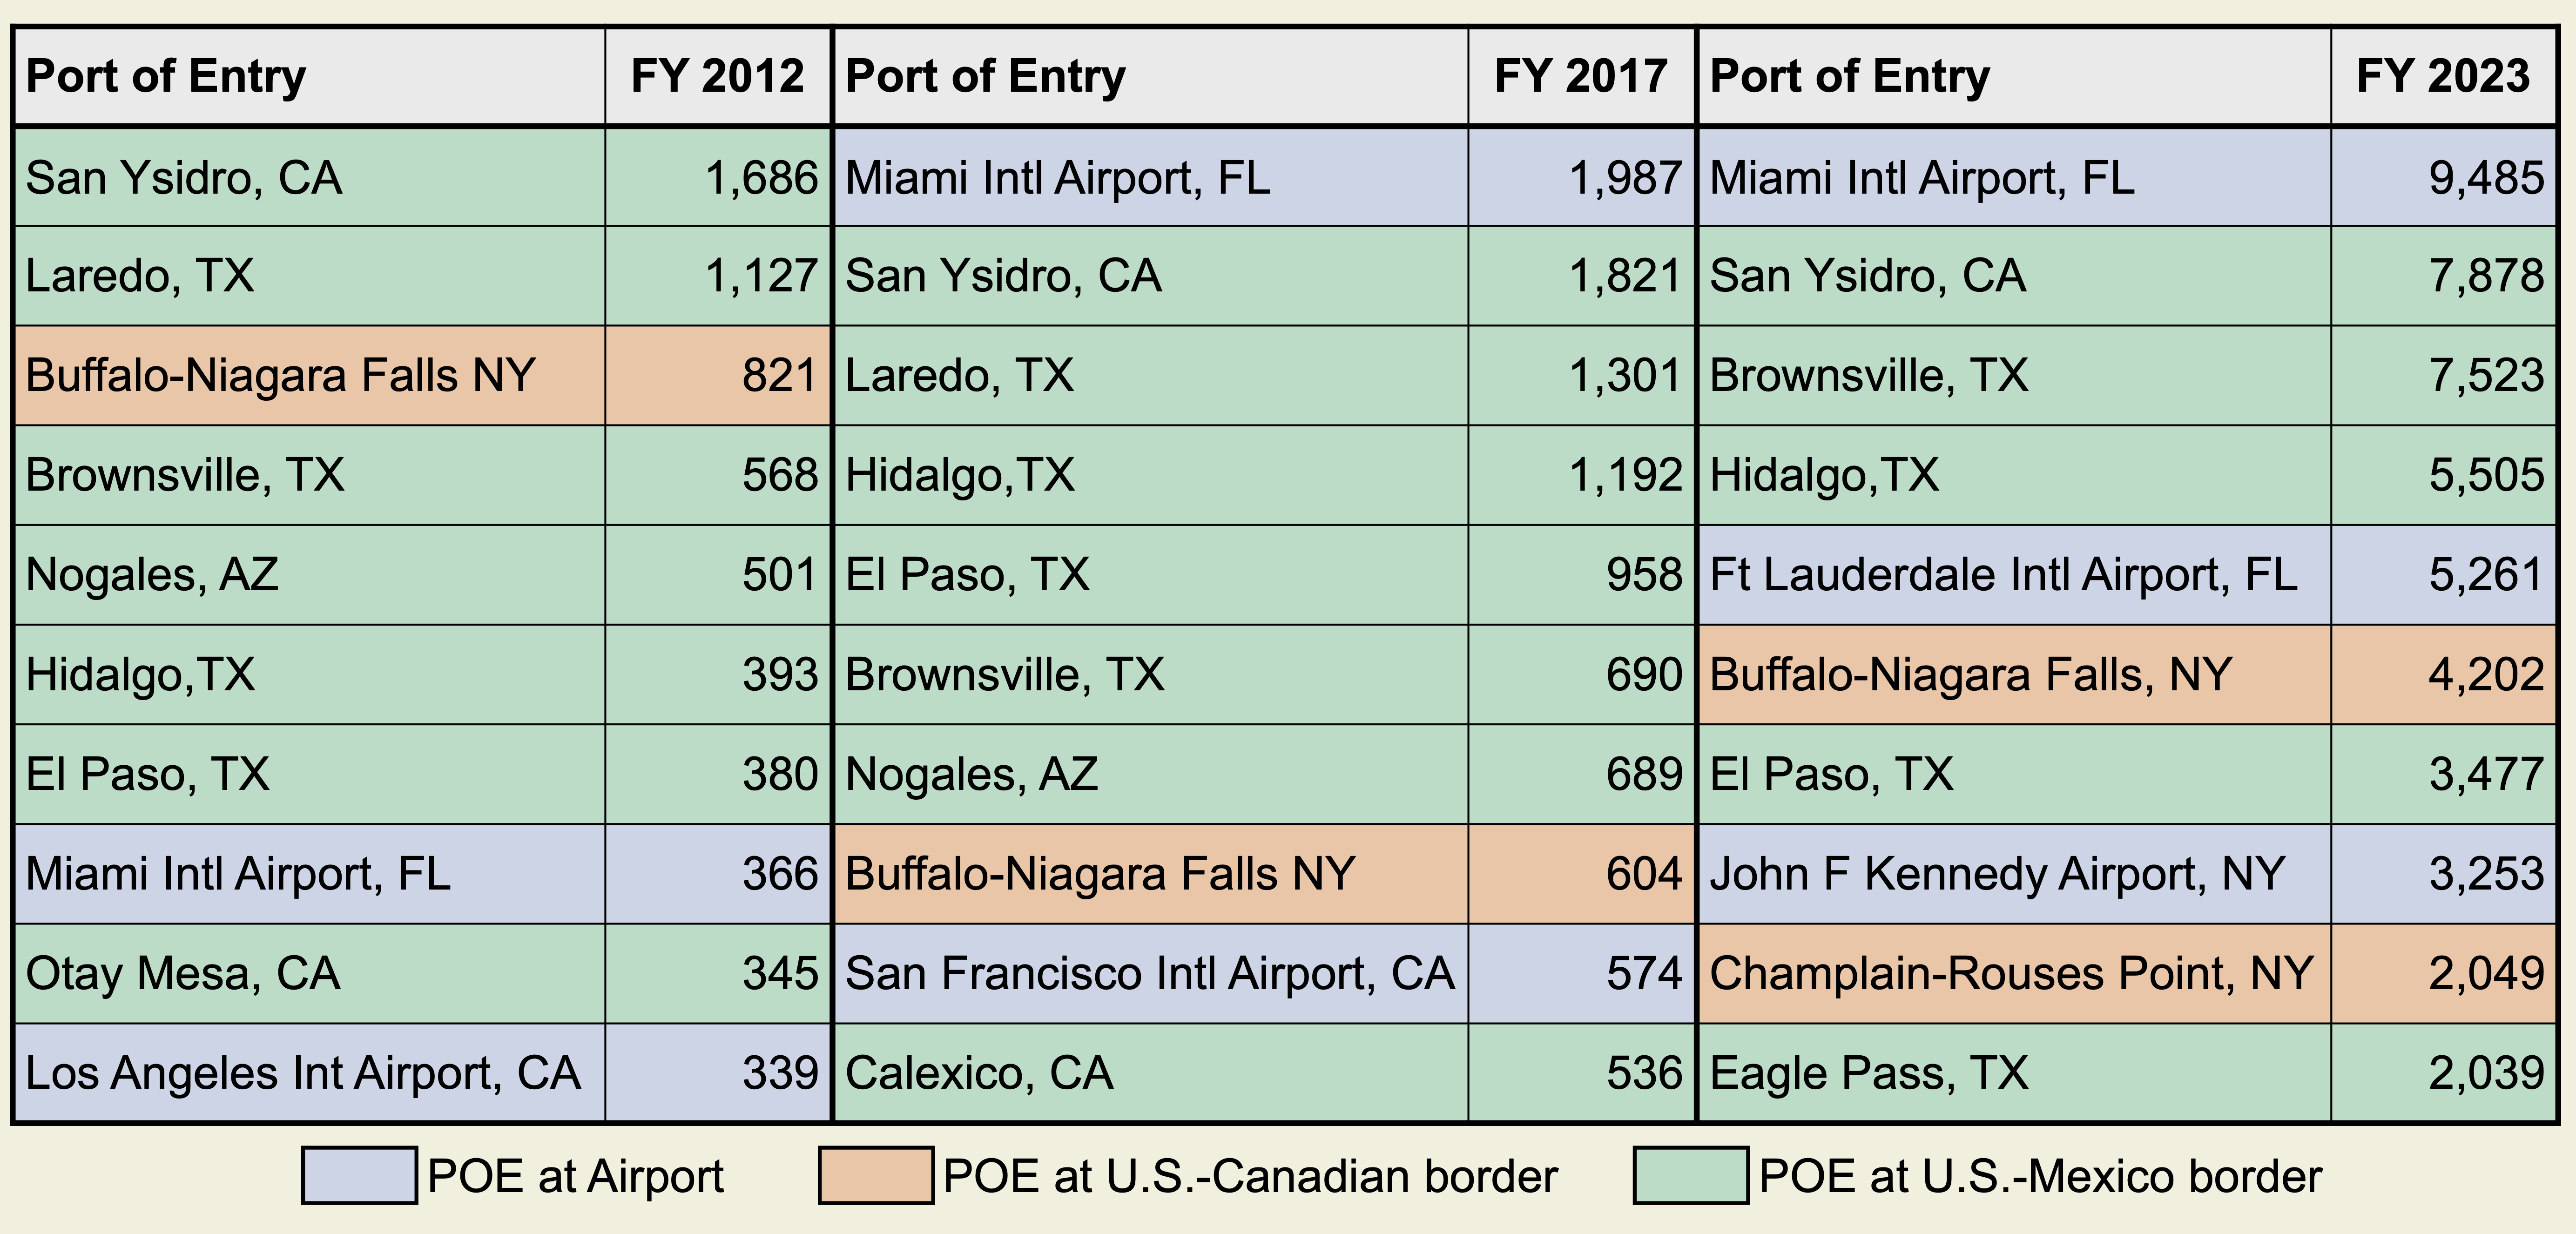
The national total of inadmissibles is concentrated in a few ports of entry: just eight ports of entry made up 60 percent of all inadmissibles in the first 10 months of 2023.[8] In FY 2023, Miami International Airport, FL, had an average of 9,485 inadmissibles per month, the highest monthly average of inadmissible immigrants at a single port of entry at any time over the last 12 years. Among ports of entry located at airports, Ft. Lauderdale International Airport, FL, came second with an average of 5,261 per month, followed by John F. Kennedy Airport, NY, with 3,253 per month. Notably, three airports made the top ten busiest ports of entry in FY 2023.
At the US-Mexico border, San Ysidro, CA, consistently had the highest number of inadmissible immigrants, with an average of 7,878 per month in FY 2023, followed by Brownsville, TX, at 7,523. Ports of entry at the US-Mexico border made up seven of the top ten busiest ports in FY 2012 and FY 2017, but only five of the top ten in FY 2023.
With 4,202 monthly inadmissibles in FY 2023, Buffalo-Niagara Falls, NY had the highest average among ports of entry located along the US-Canada border, followed by Champlain-Rouses Point, NY (2,049). While most inadmissibility determinations are made at ports of entry at airports or the US-Mexico border, FY 2023 differed from previous years in that two ports of entry located at the US-Canada border were among the top ten for inadmissible determinations.
Paroled Migrants by Ports of Entry
As shown in Table 3, airports and other interior locations—not always ports of entry along the U.S.-Mexico border—appear to be the busiest locations for inadmissibles who are recorded at the port as being paroled into the country. In FY 2023, the top ten busiest ports of entry for parolees consisted entirely of airports and ports relatively far from either the northern or southern borders of the United States. Miami International Airport is the busiest airport for paroled migrants, with an average of 9,216 paroled monthly in FY 2023, followed by another Florida airport, Ft. Lauderdale International Airport, with a monthly average of 5,179 paroled. In third place is John F. Kennedy Airport with on average 3,070 paroled per month.[9]
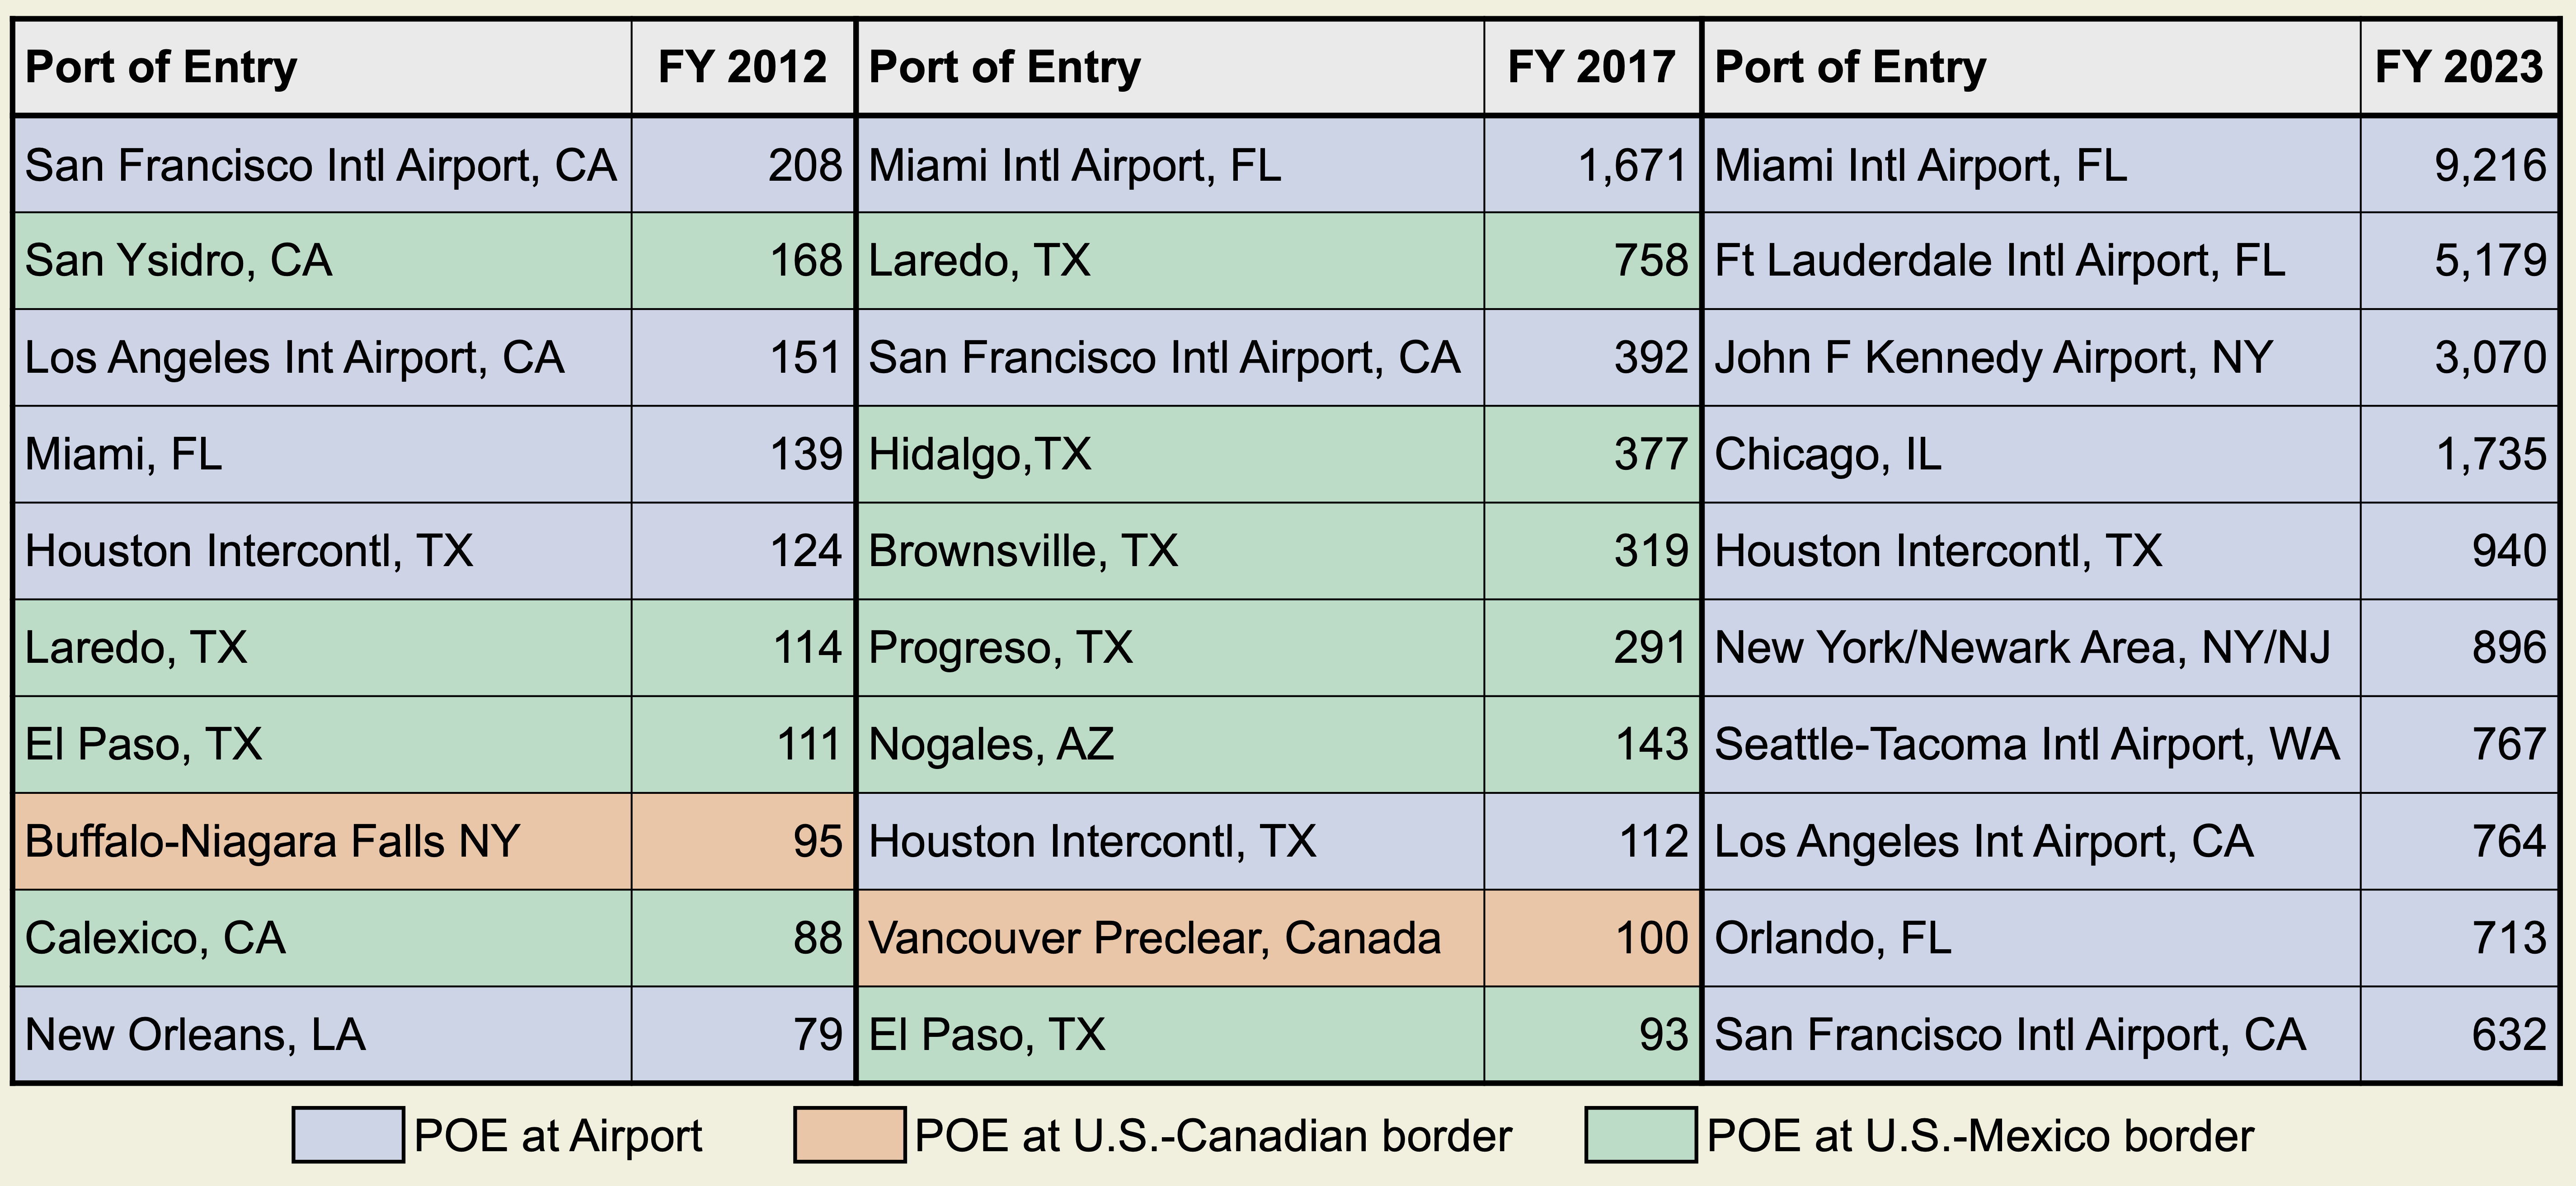
Some ports of entry along the U.S.-Canada and U.S.-Mexico borders make the top ten busiest for paroled migrants in FY 2012 and FY 2017, but not in FY 2023. With 95 paroled decisions every month, Buffalo-Niagara Falls, New York was the busiest US-Canada port of entry in FY 2012. In FY 2017, the U.S. Preclearance Area in Vancouver paroled 100 individuals per month, the highest for US ports with Canada that year. At an average of 168 parole decisions a month, the U.S. port at San Ysidro was the busiest for paroled decisions in FY 2012. Laredo, Texas, was the busiest port of entry in FY 2017, with 758 monthly paroled dispositions in FY 2017.