CBP’s Inadmissible Data at U.S. Ports of Entry Show Changes in Migration Patterns
Published Oct 30, 2023
The number of people found to be inadmissible at U.S. ports of entry rose to an all-time high in the summer of 2023. In the two months of June and July 2023, Office of Field Operations (OFO) officers determined that a total of 199,535 were inadmissible, including 101,450 in June and 98,085 in July.[1] This is over four times the level typically encountered during the last decade up until monthly numbers began to rise in 2021.[2]
This report focuses on the first ten months of Fiscal Year 2023 when a total of 788,953 inadmissible immigrants arrived at ports of entry. Findings presented are based on person-by-person records analyzed by Transactional Records Access Clearinghouse (TRAC) at Syracuse University of detailed information obtained from port authorities after a long campaign under the Freedom of Information Act (FOIA).
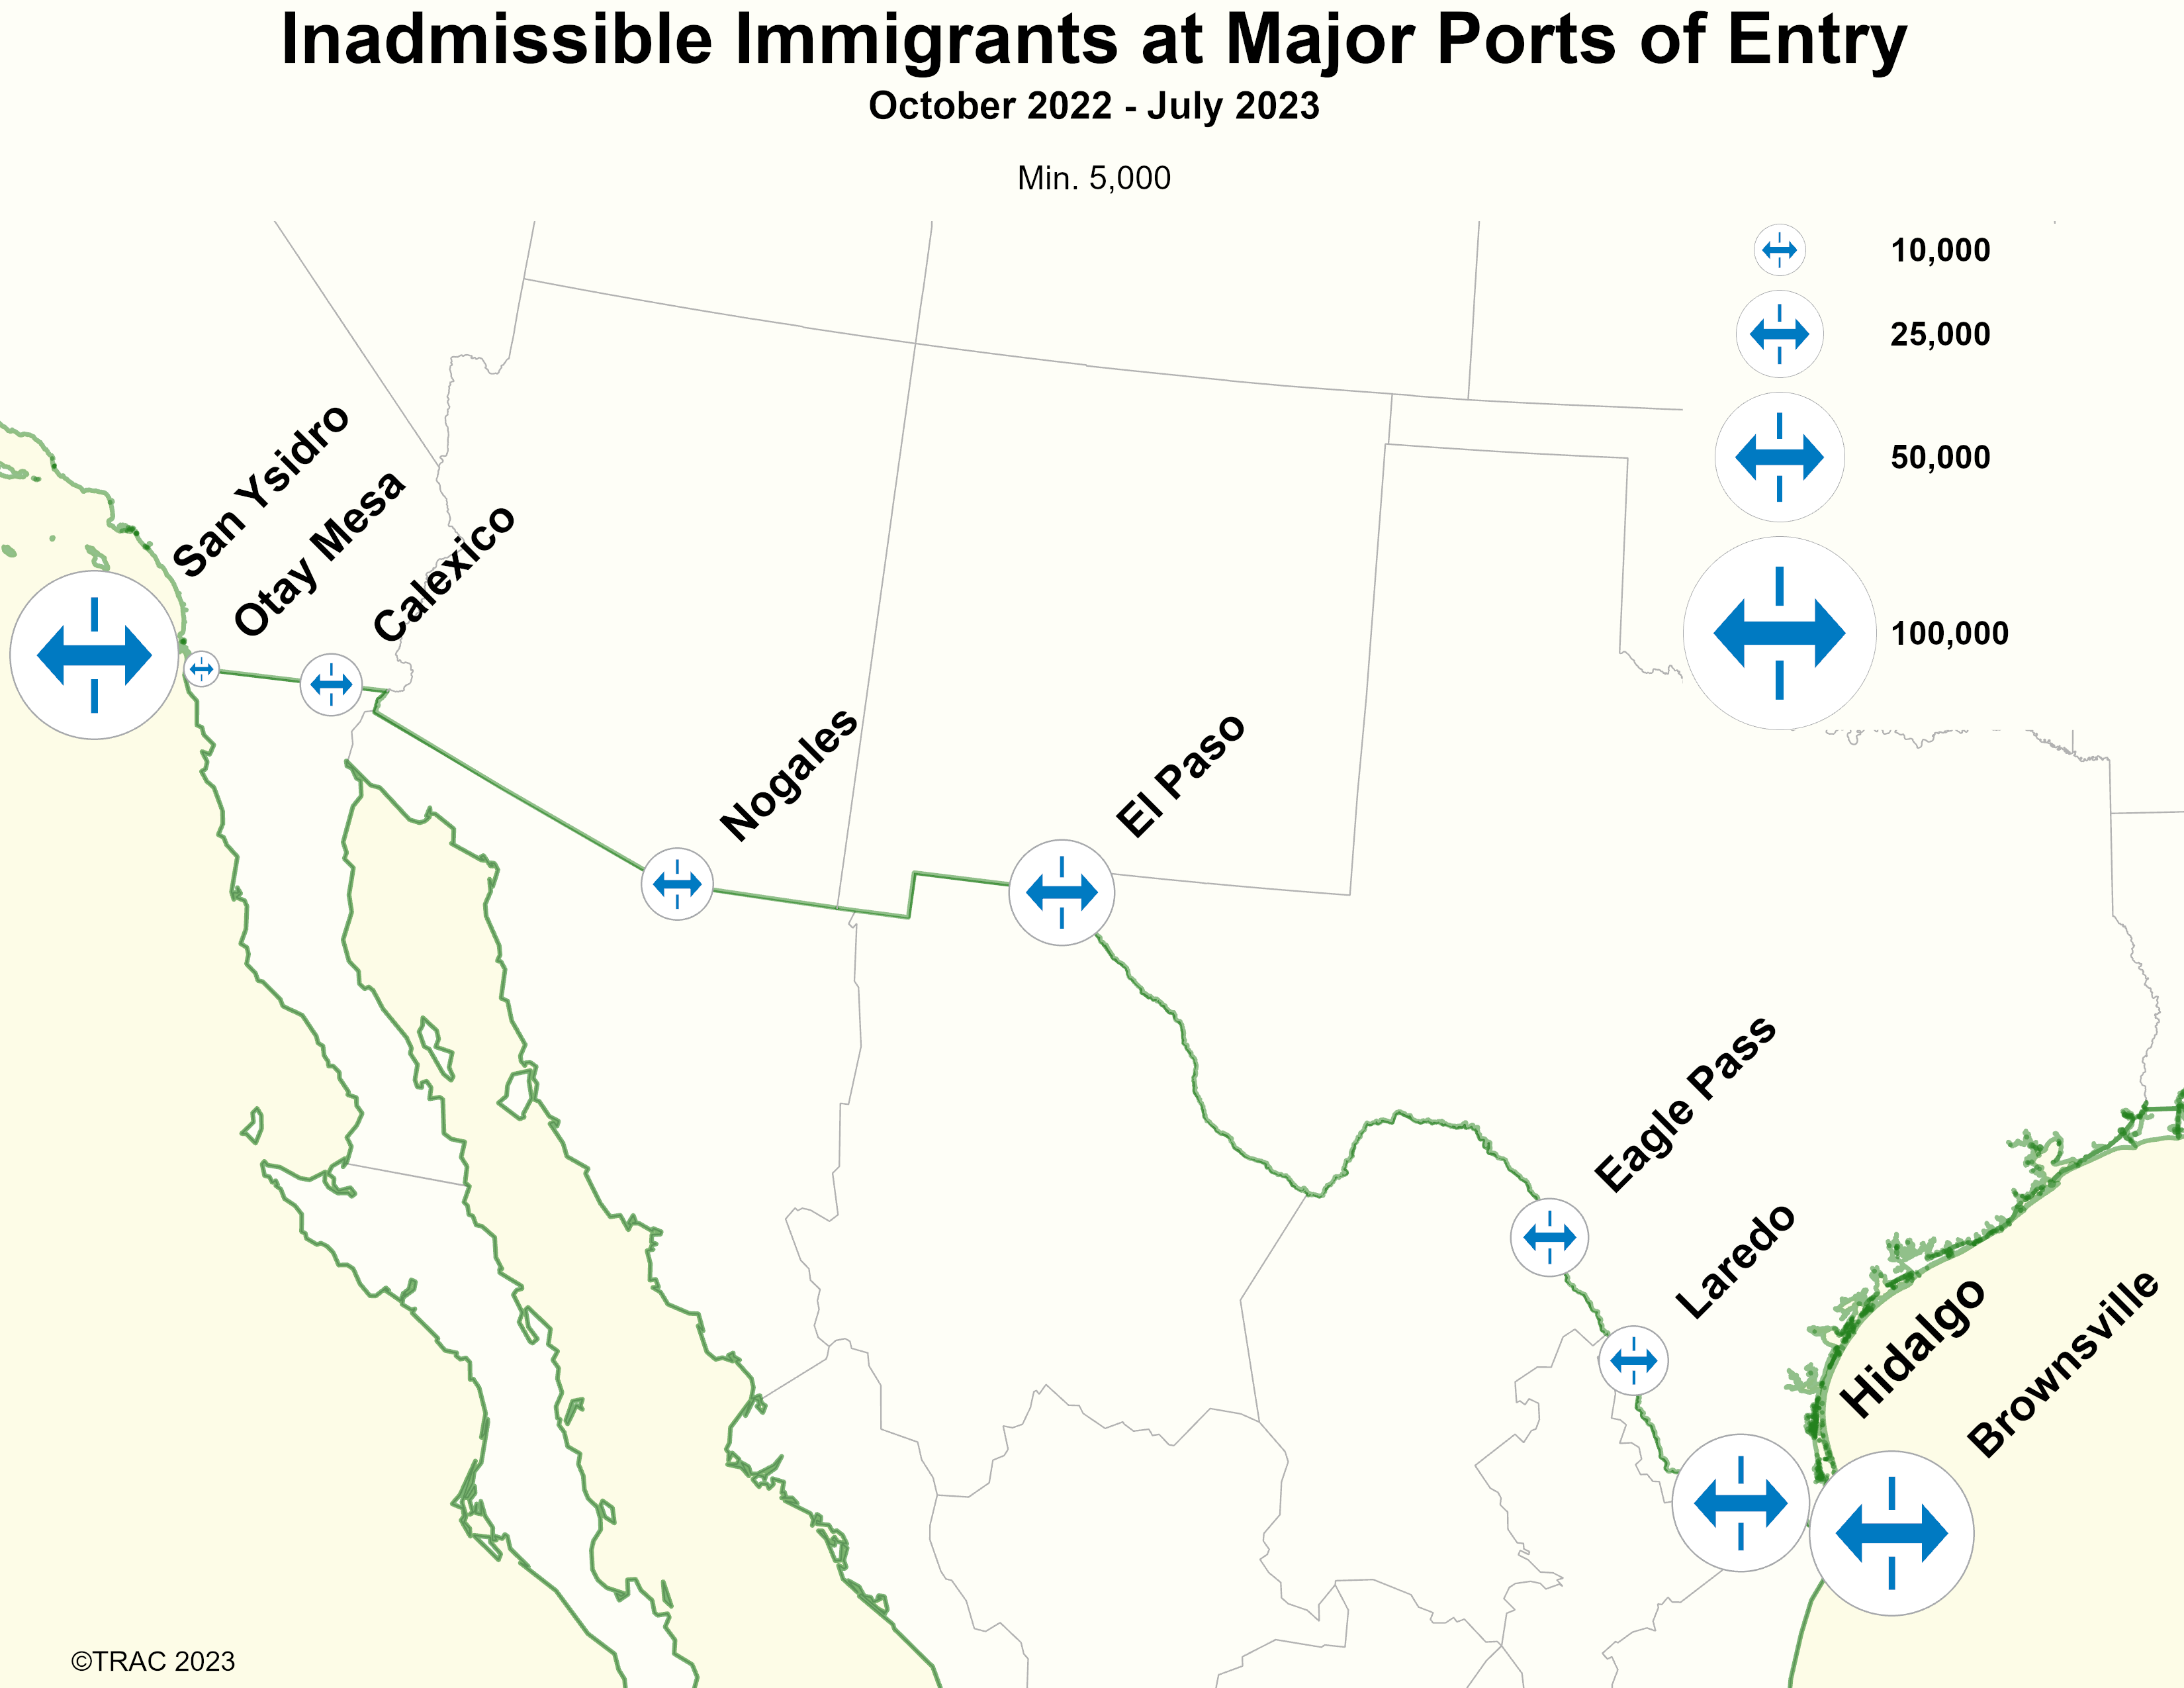
TRAC’s interactive Inadmissibles data tool now gives users the ability to view these records compiled by individual ports of entry across the country, including at the Southern and Northern Borders as well as airports.[3] Figure 1 shows the nine land ports of entry on the U.S.-Mexico border with the highest volume of inadmissible determinations for the first ten months of fiscal year 2023 (October 2022 to July 2023). San Ysidro (78,773), Brownsville (75,230), and Hidalgo (55,030) were the three busiest ports of entry by total number of inadmissible decisions. El Paso was in the middle with 34,768 inadmissibles. Less prominent ports of entry saw fewer total inadmissibles: Eagle Pass (20,386), Nogales (17,843), Laredo (16,718), Calexico (13,772), and Otay Mesa (5,105). Smaller ports of entry not pictured here saw fewer numbers.
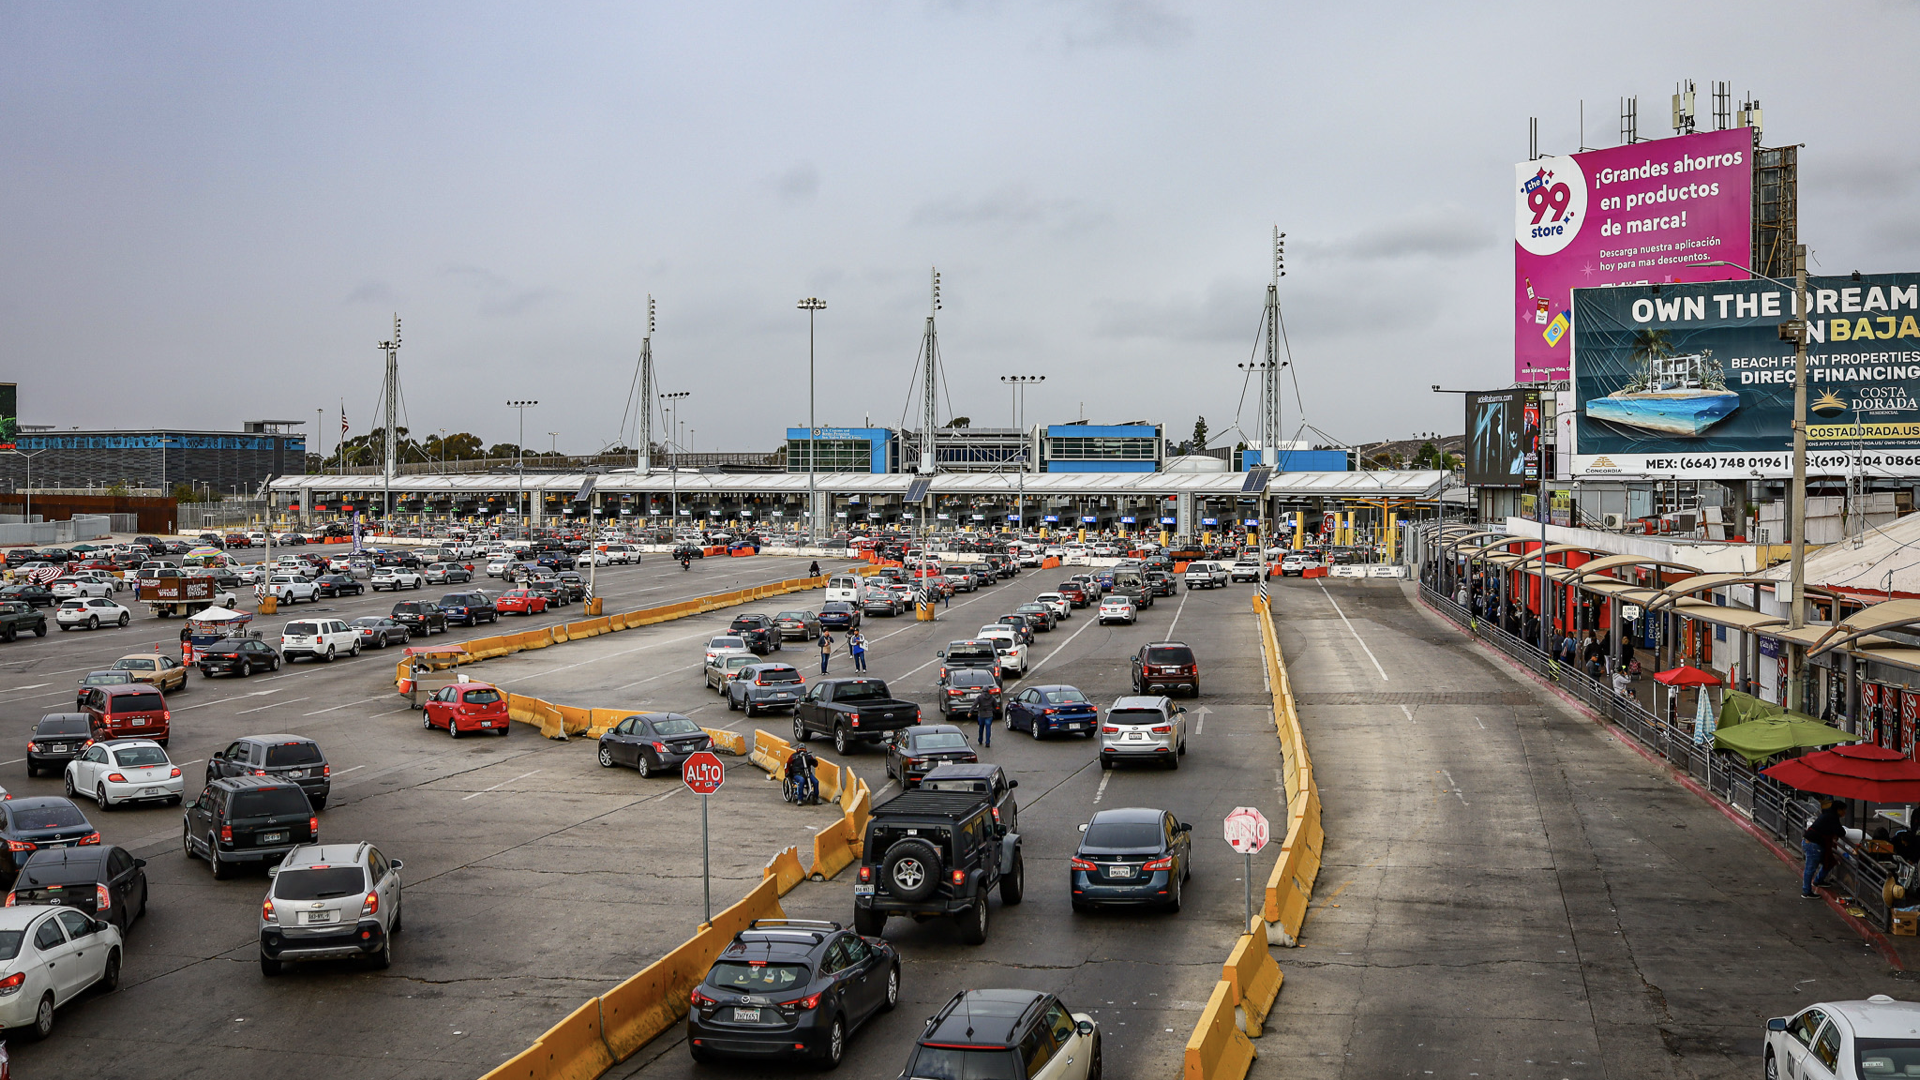
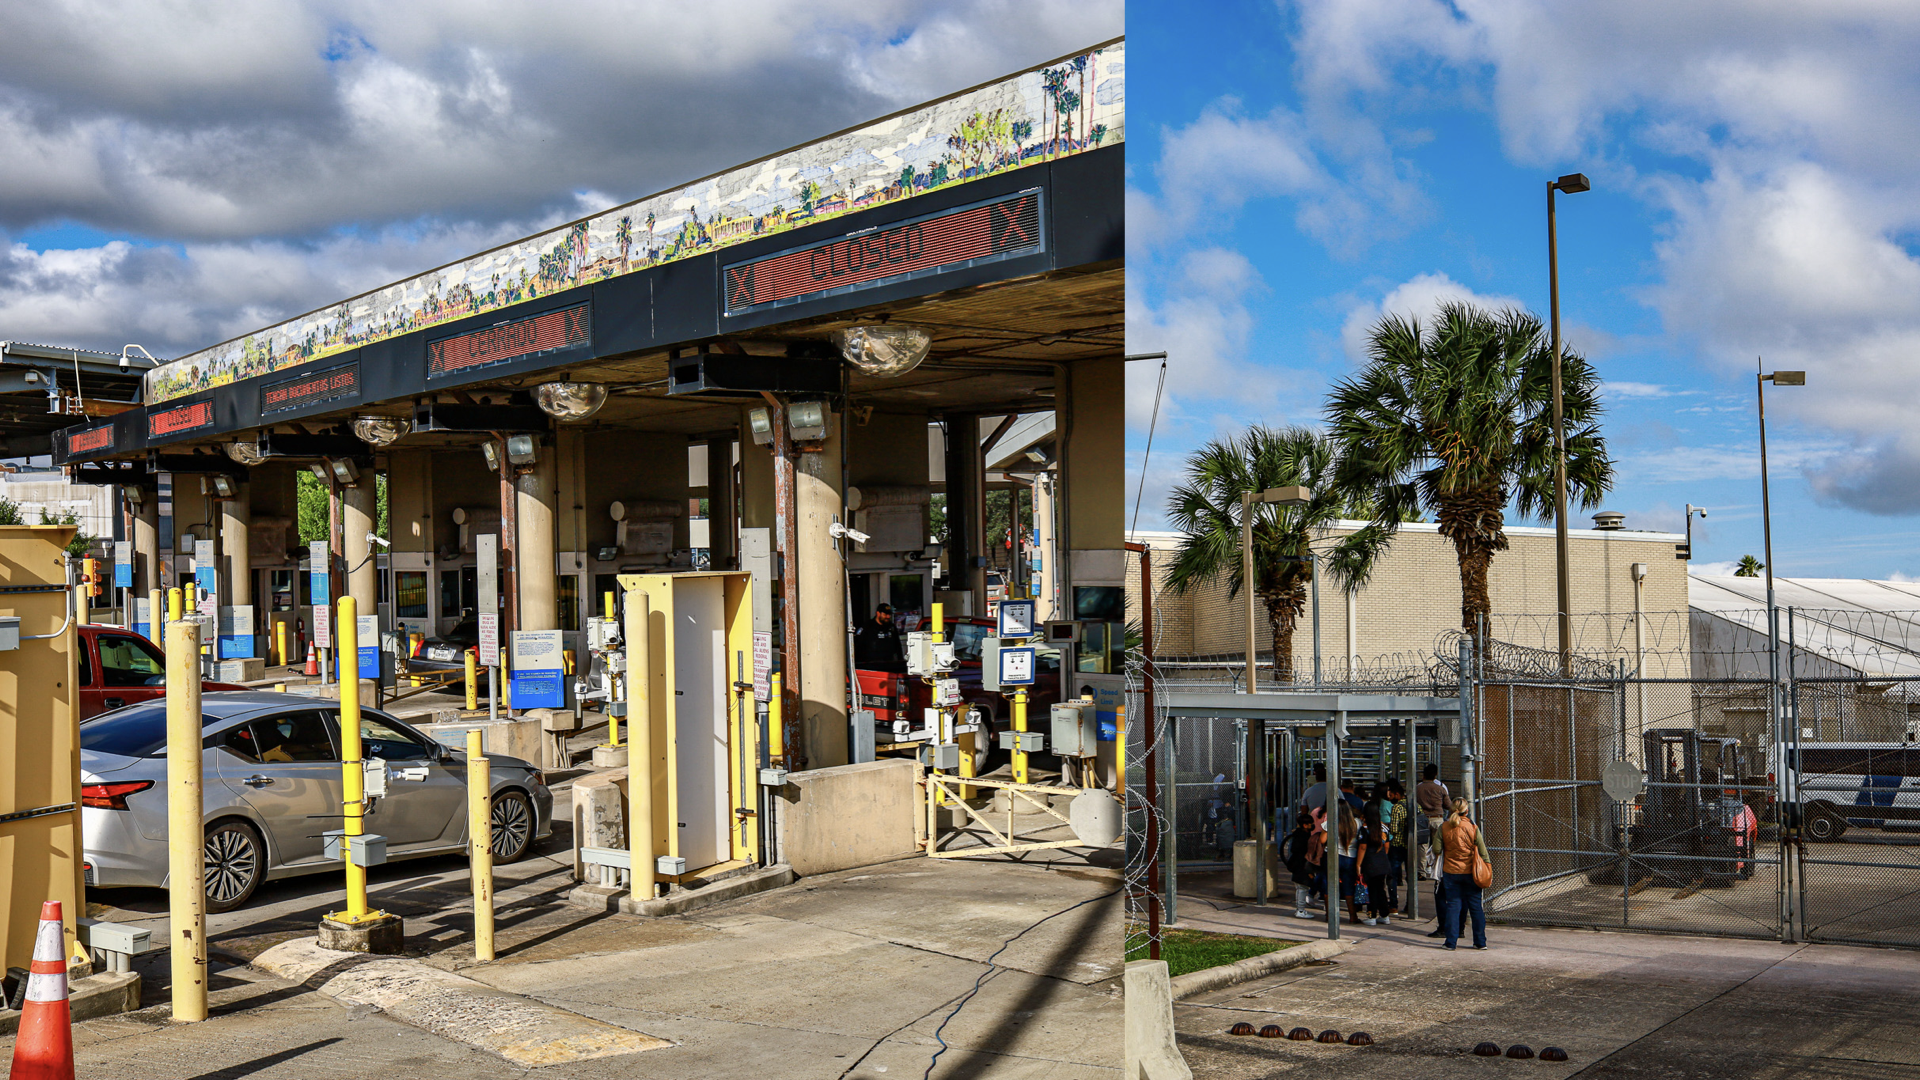
The volume of inadmissibles not only reflects patterns in migration, it also reflects the size and processing capacity of ports of entry. When larger numbers of migrants arrive at smaller ports of entry, it may create staffing and resource demands that exceed normal capacity. For instance, the San Ysidro port of entry in San Diego (see Figure 2) is one of the busiest land crossings in the world, with many lanes for vehicle traffic and a large pedestrian crossing area. By contrast, the Brownsville port of entry in South Texas (see Figure 3) is significantly smaller even though it has received nearly the same numbers of inadmissibles as San Ysidro.
Other factors beyond the physical size of these ports of entries also contribute to the number of inadmissibles arriving at each port. Various schemes to limit the number of individuals without entry documents who were permitted to approach ports of entry have long been used. For instance, starting in January 2023, CBP began requiring asylum seekers to schedule appointments at one of eight designated ports of entry[4] using the CBP One smartphone app, then face screening by CBP officers before being allowed to enter the country to pursue asylum claims.
As of the publication of this report, CBP makes 1,450 total appointments available per day for select ports of entry along the length of the border. While this process of explicitly limiting the number of asylum seekers appears similar to previous “metering” programs that restricted the number of migrants processed per day, the use of CBP One also coincides with overall growth in the number of inadmissibles at several of the eight designated crossings.
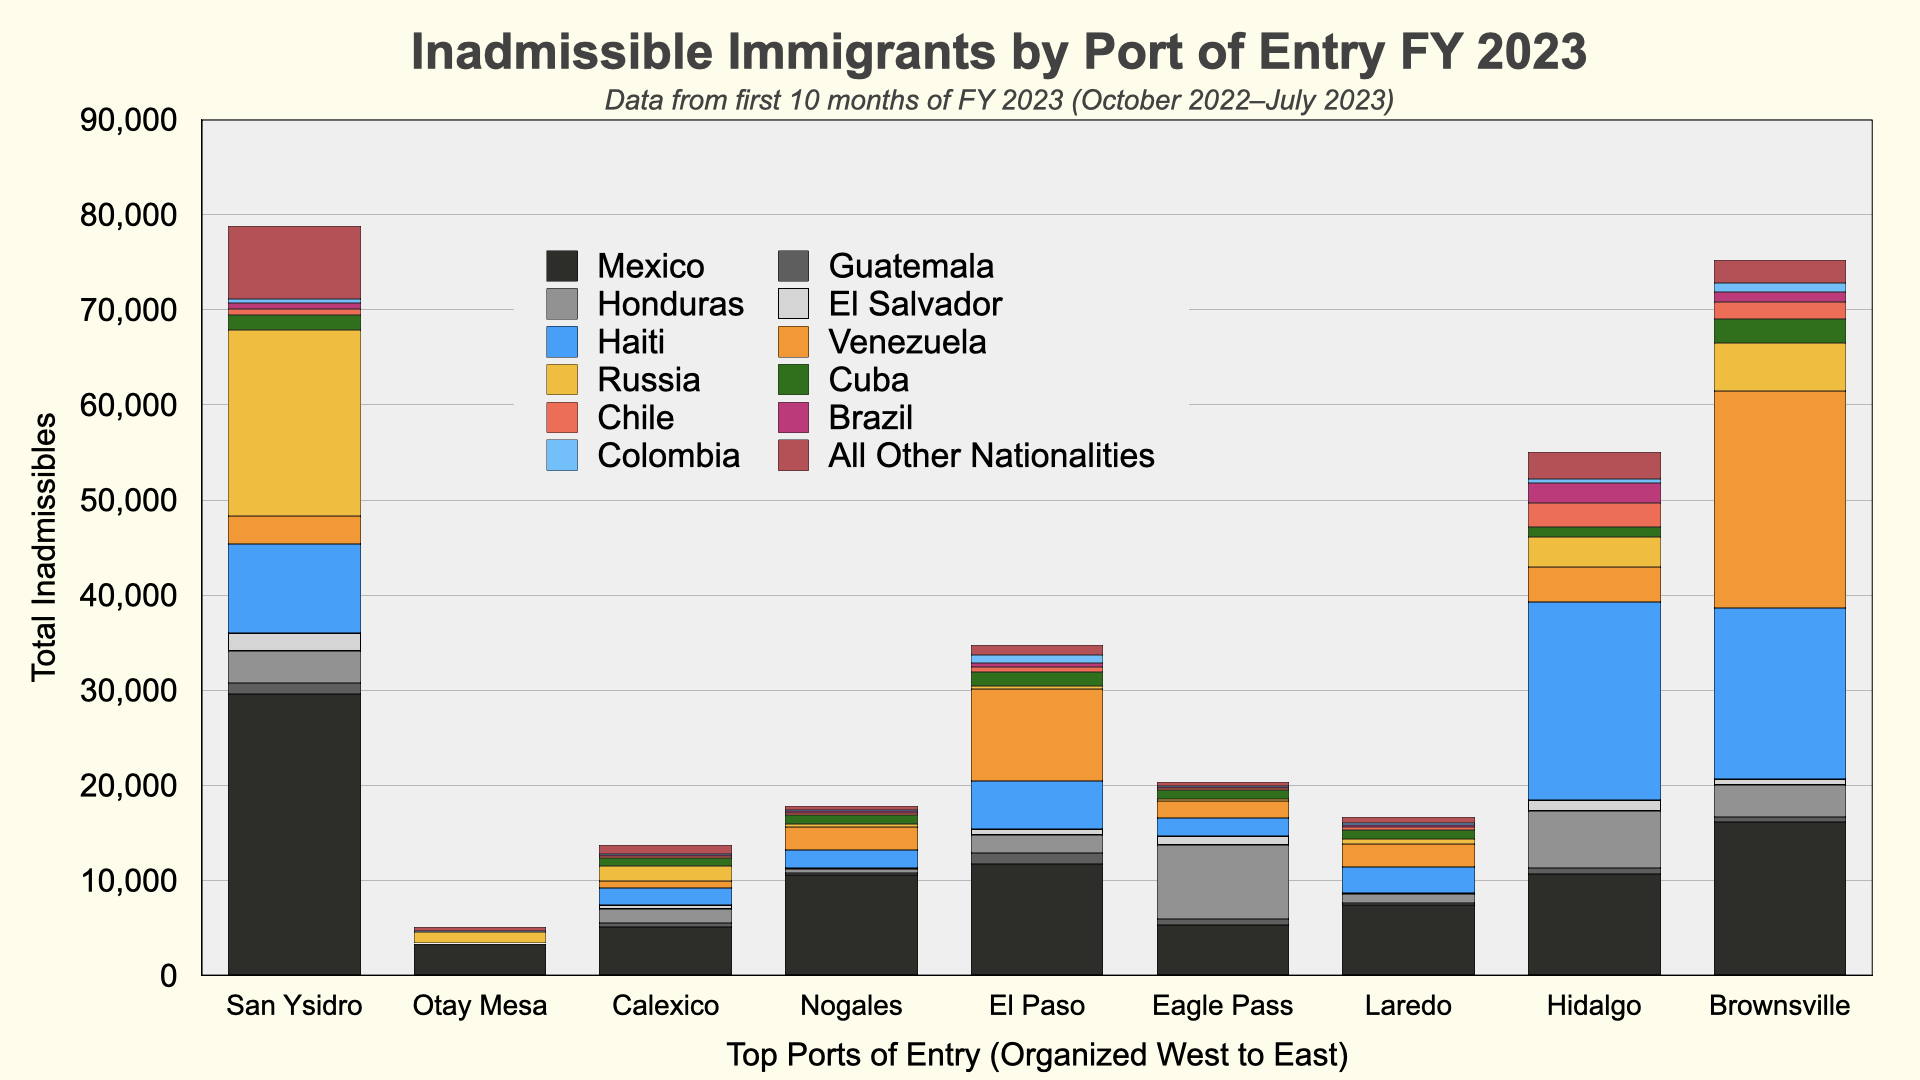
The nationality of inadmissibles varied widely between the busiest ports of entry. Figure 2 shows the total number of common citizenships receiving inadmissibility decisions at the U.S.-Mexico border, arranged from the western-most land port of entry (San Ysidro) to the eastern-most port of entry (Brownsville).
While the largest number of decisions were issued to Mexican citizens, a diverse population is requesting admission at these larger ports of entry. For example, nearly 20,000 Russians were identified as inadmissible in San Ysidro, making up a sizeable proportion of the overall total. By contrast, over 20,000 Haitians were identified as inadmissible in Hidalgo and over 22,000 Venezuelans in Brownsville for this period of data.