Narcotics/Drugs Convictions for 2023
Number Year-to-date 13,987 Percent Change from previous year 8 Percent Change from 5 years ago 4.3 Percent Change from 10 years ago -19.2 Percent Change from 20 years ago -31.5
Table 1: Criminal Narcotics/Drugs ConvictionsThe latest available data from the Justice Department show that during the first nine months of FY 2023 the government reported 13,987 new narcotics/drugs convictions. If this activity continues at the same pace, the annual total of convictions will be 18,649 for this fiscal year. According to the case-by-case information analyzed by the Transactional Records Access Clearinghouse (TRAC), this estimate is up 8% over the past fiscal year when the number of convictions totaled 17,272.
The comparisons of the number of defendants convicted for narcotics/drugs-rela offenses are based on case-by-case information obtained by TRAC under the Freedom of Information Act from the Executive Office for United States Attorneys (see Table 1).
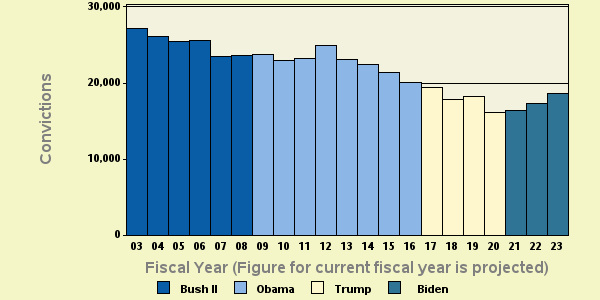
Compared to five years ago when there were 17,886, the estimate of FY 2023 convictions of this type is up 4.3 percent. Convictions over the past year are still lower than they were ten years ago. Overall, the data show that convictions of this type are down 19.2 percent from the level of 23,080 reported in 2013 and down 31.5 percent from the level of 27,206 reported in 2003.
The long term trend in narcotics/drugs convictions for these matters going back to FY 2003 is shown more clearly in Figure 1. The vertical bars in Figure 1 represent the number of narcotics/drugs convictions of this type recorded each fiscal year. Projected figures for the current fiscal year are shown. Each presidential administration is distinguished by the color of the bars. To view trends month-by-month rather than year-by-year, see TRAC's monthly report series for the latest data.
Leading Program Categories
Within the broad category of narcotics/drugs, cases were classified by prosecutors into more specific types.
Case types within narcotics/drugs are
Drugs-Drug Trafficking
Drugs-Operation Triggerlock Major
Drugs-Operation Triggerlock Other
Drugs-Organized Crime Task Force
Drugs-Simple Drug Possession
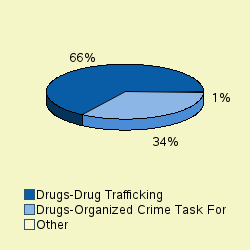
The single largest number of convictions of these matters through June 2023 was for "Drugs-Drug Trafficking", accounting for 65.8 percent of convictions.
As shown in Figure 2, the second largest number of matters were convictions filed under the program area of "Drugs-Organized Crime Task Force " (33.7%) . See Figure 2.
Leading Investigative Agencies
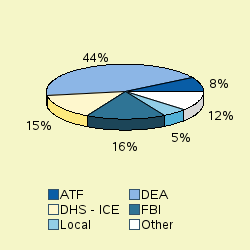
The lead investigative agency for narcotics/drugs convictions through June 2023 was "Justice - Drug Enforcement Administration" accounting for 43.5 percent of convictions.
As shown in Figure 3, additional agencies with substantial numbers of narcotics/drugs convictions were: Justice - Federal Bureau of Investigation (16.4%), "Homeland Security - Immigration and Customs Enforcement" (15%), "Justice - Alcohol, Tobacco, Firearms, and Explosives (formerly Treasury)" (8.5%), "Other - State/Local Authorities" (5%). The "Other" category in Figure 3 is comprised of a diverse group of agencies. The agencies with substantial numbers of narcotics/drugs within the "Other" category were: Homeland Security - Other" (4.9%).
Top Ranked Lead Charges
Table 2 shows the top lead charges recorded in the convictions of narcotics/drugs matters filed in U.S. District Court during the first nine months of FY 2023.
Note: There were an additional 136 other lead charges which were not individually ranked. See latest monthly report if you want all lead charges included in rankings for the latest month, or use TRACFED criminal analyzer tool for complete listing for any year.
Lead Charge Count Rank 1 yr ago 5 yrs ago 10 yrs ago 20 yrs ago 21 USC 841 - Drug Abuse Prevention & Control-Prohibited acts A 7,340 1 1 1 1 1 More 21 USC 846 - Attempt and conspiracy 3,733 2 2 2 2 2 More 21 USC 952 - Importation of controlled substances 1,032 3 3 3 3 3 More Other US Code Section 401 4 4 12 14 6 More 18 USC 922 - Firearms; Unlawful acts 332 5 5 5 6 9 More 46 USC 70503 - Possession control substance on vessel subject to jurisdiction of US 281 6 7 4 9 - More 46 USC 70506 - Penalties 111 7 9 8 12 - More 21 USC 963 - Attempt and conspiracy 109 8 6 7 5 5 More 18 USC 1956 - Laundering of monetary instruments 93 9 10 10 7 7 More 21 USC 843 - Drug Abuse Prevention & Control-Prohibited acts C 39 10 11 13 10 8 More
Table 2: Top charges for convictions
"Drug Abuse Prevention & Control-Prohibited acts A" (Title 21 U.S.C Section 841) was the most frequent recorded lead charge. Title 21 U.S.C Section 841 was ranked 1st a year ago, while it was the 1st most frequently invoked five years ago. It was ranked 1st ten years ago and 1st twenty years ago.
Ranked 2nd in frequency was the lead charge "Attempt and conspiracy" under Title 21 U.S.C Section 846. Title 21 U.S.C Section 846 was ranked 2nd a year ago, while it was the 2nd most frequently invoked five years ago. It was ranked 2nd ten years ago and 2nd twenty years ago.
Ranked 3rd was "Importation of controlled substances" under Title 21 U.S.C Section 952. Title 21 U.S.C Section 952 was ranked 3rd a year ago, while it was the 3rd most frequently invoked five years ago. It was ranked 3rd ten years ago and 3rd twenty years ago.
Again among the top ten lead charges, the one showing the sharpest projected decline in convictions compared to one year ago—down -21 percent—was "Importation of controlled substances " (Title 21 U.S.C Section 952 ). This was the same statute that had the largest projected decrease—-21%—when compared with five years ago.
Top Ranked Judicial Districts
During FY 2022 the Justice Department said the government obtained 52 narcotics/drugs convictions for every one million people in the United States. If pace during the first nine months of FY 2023 continues at the same rate, narcotics/drugs convictions for one million people in the United States this year will be 56.2 . Understandably, there is great variation in the per capita number of narcotics/drugs convictions in each of the nation's ninety-four federal judicial districts
Judicial District Percapita Count Rank 1yr ago 5yrs ago 10yrs ago 20yrs ago Cal, S 503 1,307 1 1 1 1 3 More N Dakota 289 168 2 2 2 7 45 More W Virg, S 197 127 3 17 8 10 13 More Alaska 158 83 4 25 21 22 69 More W Virg, N 146 101 5 4 5 4 7 More Montana 140 116 6 15 12 13 18 More Tenn, E 140 284 7 9 16 6 27 More N Mexico 136 216 8 7 3 3 2 More Tenn, W 131 153 9 26 25 8 34 More Nebraska 128 188 10 14 10 16 6 More
Table 3: Top 10 districts (per one million people)
The Southern District of California (San Diego)—with 502.80 convictions as compared with 56.2 convictions per one million people in the United States—was the most active through June 2023. The Southern District of California (San Diego) was ranked 1st a year ago as well as five years ago. The district's position ten years ago was 1st and 3rd twenty years ago.
The District of North Dakota ranked 2nd. The District of North Dakota was ranked 2nd a year ago as well as five years ago. The district's position ten years ago was 7th and 45th twenty years ago.
The Southern District of West Virginia (Charleston) now ranks 3rd.
Recent entries to the top 10 list were Nebraska, Montana, Southern District of West Virginia (Charleston), Alaska and Western District of Tennessee (Memphis), now ranked 10th, 6th, 3rd, 4th and 9th. These districts ranked 14th, 15th, 17th, 25th and 26th one year ago and 10th, 12th, 8th, 21st and 25th five years ago.
Compared to 10 years ago, Montana, Nebraska and Alaska now ranked in the top 10 did not appear in the top ten.
And compared to 20 years ago, Southern District of West Virginia (Charleston), Montana, Eastern District of Tennessee (Knoxville), Western District of Tennessee (Memphis), North Dakota and Alaska were not sufficiently active to then make the top 10.
The federal judicial district which showed the greatest projected growth in the rate of narcotics/drugs convictions compared to one year ago—104 percent—was Southern District of West Virginia (Charleston). Compared to five years ago, the district with the largest projected growth—73.0 percent—was Alaska .
In the last year, the judicial District Court recording the largest projected drop in the rate of narcotics/drugs convictions—16.4 percent—was Northern District of West Virginia (Wheeling).
Report Generated: September 13, 2023