Convictions for Transporting or Harboring Undocumented Immigrants Jump Under Biden
Published Jul 13, 2023
The latest available data from the Justice Department show that during the first eight months of FY 2023 the government reported a record 3,894 new convictions for bringing in or harboring undocumented immigrants (8 U.S.C. 1324). The average prison sentence under this lead charge was 11 months, while the median sentence – half received longer sentences while half received shorter – was 6 months.[1]
Monthly convictions with this lead charge leaped to an all-time high of 708 in January 2023, far outpacing the previous high of 476 in January 2020 under former President Trump. If this same pace continues, the recorded convictions will be 5,841 for this fiscal year, which continues through the end of September. This would represent an increase of 37 percent over FY 2022 when the number of convictions totaled 4,273.
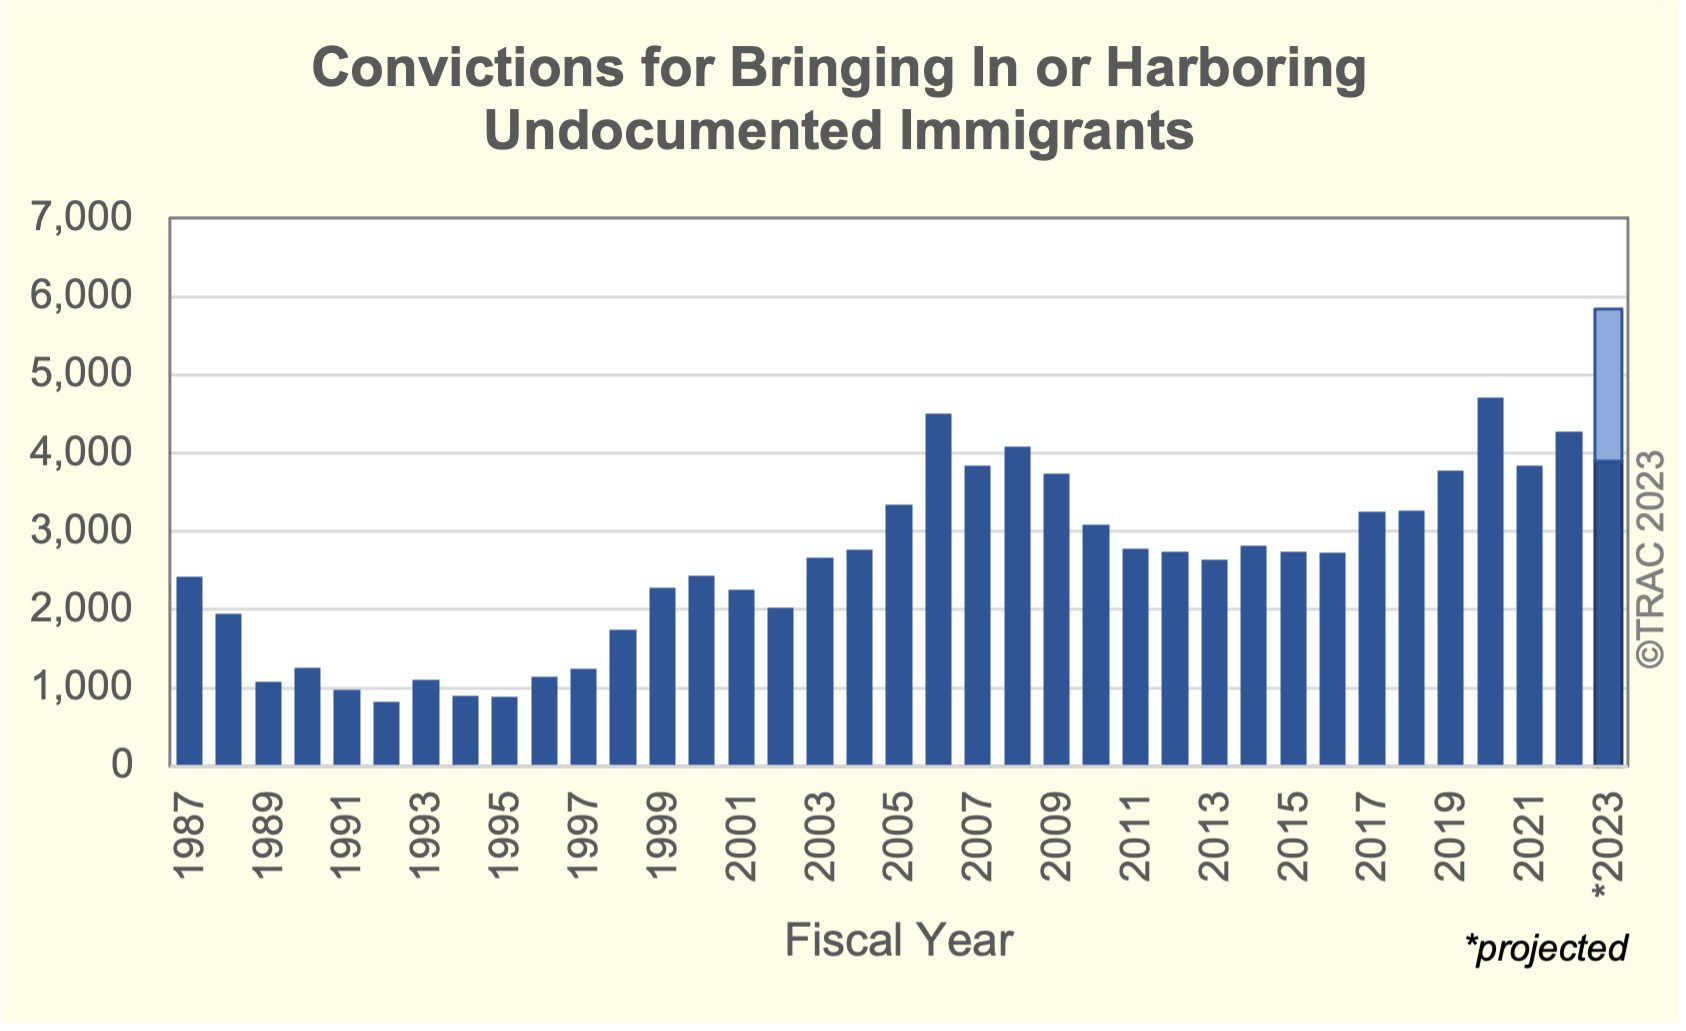
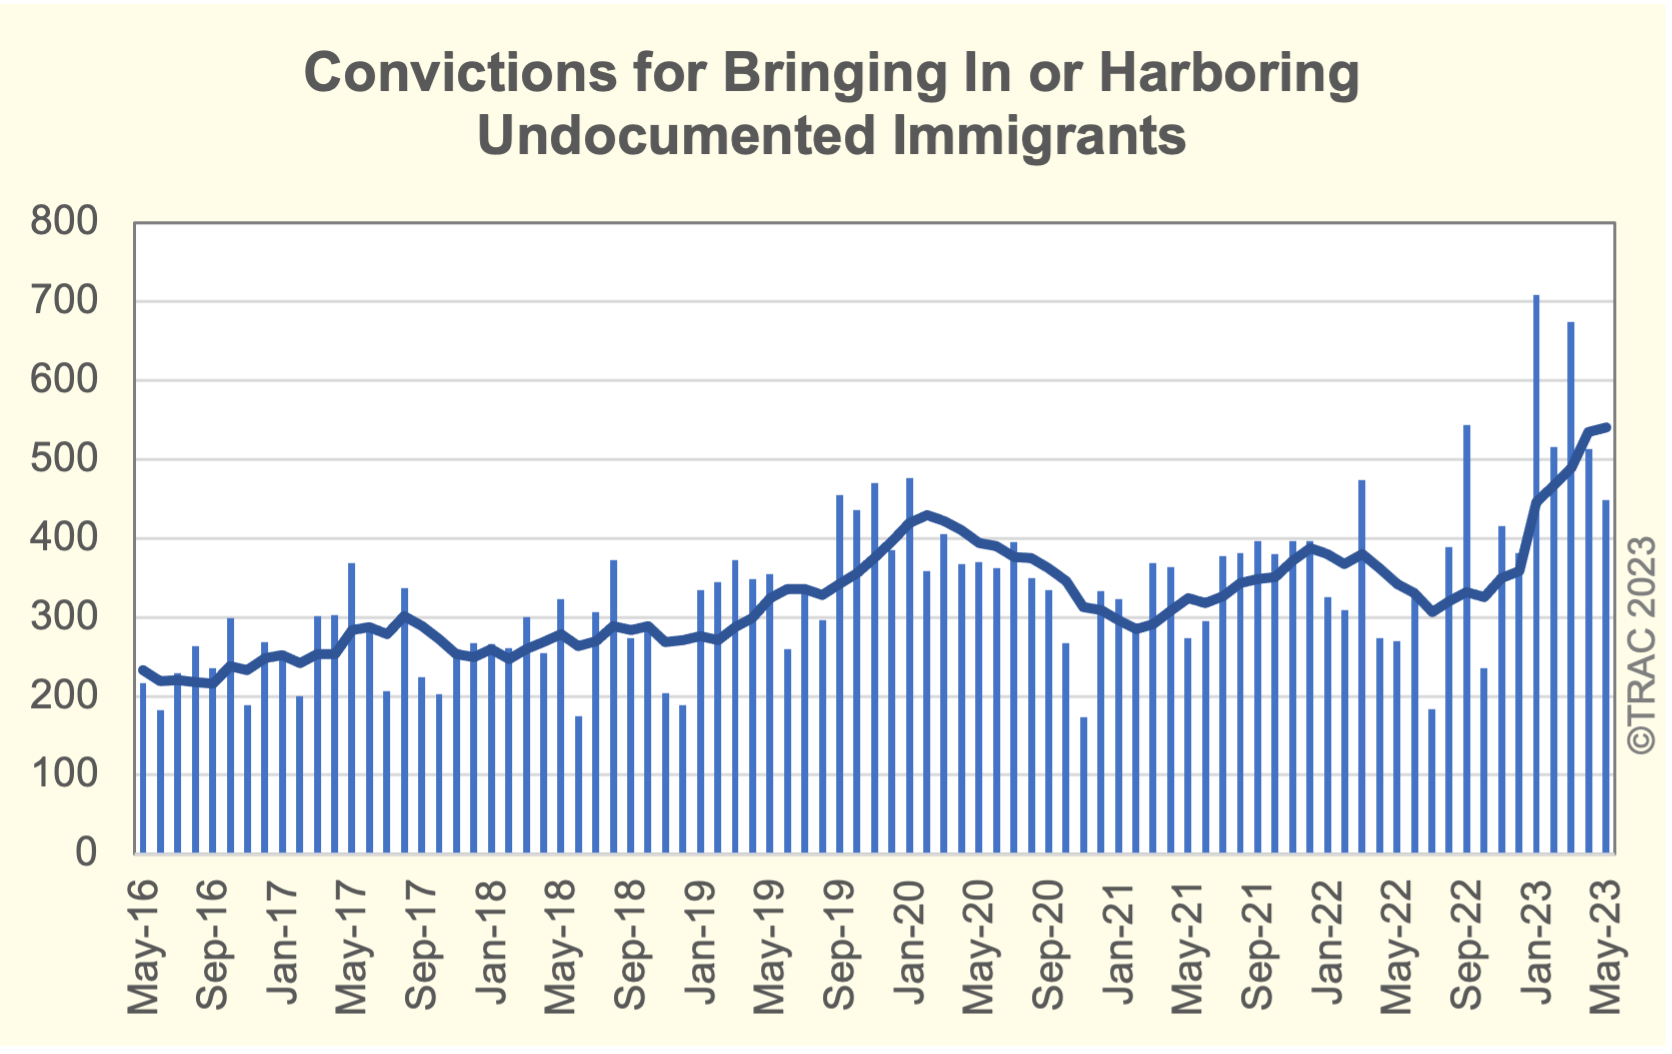
The comparisons of the number of defendants convicted for these offenses were compiled based on case-by-case data obtained after successful court litigation under the Freedom of Information Act (FOIA) by the Transactional Records Access Clearinghouse (TRAC). See Figure 1 for annual trends and Figure 2 for recent month-by-month details. The solid line in Figure 2 represents the six-month moving average which smooths out monthly fluctuations.
Our earliest data begins in FY 1987 in the year following the passage of the Immigration Reform and Control Act (IRCA) of 1986, which allowed nearly 2.7 million unauthorized residents to subsequently become lawful residents. In 1987 under the Reagan presidency there were 2,400 convictions for harboring offenses. This number declined each year and leveled off at around 1,000 per year during the George H. W. Bush and first Bill Clinton administrations. Numbers then began to climb.
As shown in Figure 1, by the end of the second four-year Clinton presidency, convictions had more than doubled and continued to increase under the George W. Bush administration when they peaked at more than 4,500 during FY 2006. During the Obama presidency they fell below 3,000. Convictions then climbed again under the Trump administration to 4,700 in 2020, only several hundred higher than the previous 2006 peak. This level after dipping, rapidly escalated to the current peak under President Biden.
Comparing Specific Offenses Charged
Convictions under 8 U.S.C. 1324 aren’t limited to smuggling undocumented immigrants across the U.S. border. In comparison to this charge, almost three times the number of convictions since FY 2018 were under a subsection of 1324 which makes it illegal to transport or attempt to transport such individuals within the U.S. Of course, the division between smuggling immigrants across the border and transporting undocumented immigrants within the U.S. is not clear cut since smuggling can involve both border crossing and transport away from the border.
However, nearly a thousand convictions also occurred for defendants who simply concealed undocumented immigrants or helped them evade authorities. Convictions for encouraging or inducing an undocumented immigrant to come to, enter, or reside in the U.S. remain relatively rare. See Table 1.
| Lead Charge Including Subsection (as labeled in U.S. Attorney records) | Fiscal Year | Total | |||||
|---|---|---|---|---|---|---|---|
| FY 2018 | FY 2019 | FY 2020 | FY 2021 | FY 2022 | *FY 2023 | ||
| Total | 3,262 | 3,778 | 4,709 | 3,837 | 4,273 | 3,894 | 23,753 |
| 08 USC 1324a1Aii - Transport/moves/attemts to transport illegal aliens within the US | 1,459 | 1,533 | 2,363 | 1,689 | 1,925 | 2,295 | 11,264 |
| 08 USC 1324a1AvI - Bringing in and harboring certain aliens/conspiracy | 355 | 538 | 929 | 738 | 860 | 767 | 4,187 |
| 08 USC 1324a1Ai - Knowingly brings or attempts to bring in illegal aliens to US | 461 | 138 | 92 | 865 | 1,166 | 542 | 3,264 |
| 08 USC 1324a1AvII - Bringing in and harboring certain aliens/aiding and abetting | 195 | 689 | 696 | 198 | 42 | 16 | 1,836 |
| 08 USC 1324a2Biii - Failure to bring alien immediately to immigration officer upon arrival | 198 | 348 | 213 | 102 | 83 | 115 | 1,059 |
| 08 USC 1324a1Aiii - Harboring/concealing illegal aliens | 205 | 216 | 172 | 169 | 114 | 98 | 974 |
| 08 USC 1324a2Bii - Bringing in/harboring certain aliens for commercial adv/private finc gain | 183 | 101 | 186 | 50 | 54 | 42 | 616 |
| 08 USC 1324b1 - Any conveyance used in violation of subsection (a) shall be seized | 142 | 175 | 23 | 8 | 2 | 0 | 350 |
| 08 USC 1324a1Aiv - Encourages or induces an alien to come to, enter, or reside in the US | 46 | 24 | 21 | 11 | 23 | 12 | 137 |
| Other miscellaneous charges | 2 | 5 | 7 | 6 | 0 | 3 | 23 |
Comparing Southern, Northern, Coastal and Interior Communities
Among the 90 federal judicial districts within the 50 states, 67 districts plus the District of Columbia recorded at least one conviction with this as the lead charge since FY 2017. However, just 27 districts recorded at least 10 convictions, and just seven districts recorded 100 or more convictions during this period. These seven were the five southwest border districts plus the Southern District of Florida (Miami) and the Northern District of New York (Syracuse). Thus, despite the widespread distribution of undocumented immigrants across the nation,[2] such convictions outside border and coastal districts are still relatively rare.
Table 2 lists the ten districts with the highest relative rate of illegal transport and harboring convictions under 8 U.S.C. 1324. The five districts along the nation’s southwest border with Mexico held the top five spots. Arizona had the highest rate of convictions relative to its population so far during FY 2023. However, last year in FY 2022 New Mexico had the highest rate relative to its population size, while the highest relative rate was found in the Southern District of California (San Diego) five years as well as twenty years ago.
Three of the remaining top ten judicial districts this year are along the country’s northern border with Canada. These three are Vermont ranked sixth this year, the Northern District of New York (Syracuse) ranked seventh, and Montana ranked tenth. Two coastal districts make up the remaining top ten. Relative to population size, the Southern District of Mississippi (Jackson) ranked eighth and the Southern District of Florida (Miami) ranked ninth.
| Judicial District | Percapita | Count | Rank | 1yr ago | 5yrs ago | 10yrs ago | 20yrs ago |
|---|---|---|---|---|---|---|---|
| Arizona | 297 | 1,440 | 1 | 5 | 4 | 2 | 4 |
| N Mexico | 244 | 344 | 2 | 1 | 5 | 5 | 3 |
| Cal, S | 219 | 506 | 3 | 4 | 1 | 1 | 1 |
| Texas, S | 129 | 865 | 4 | 3 | 2 | 3 | 2 |
| Texas, W | 110 | 564 | 5 | 2 | 3 | 4 | 5 |
| Vermont | 37 | 16 | 6 | 10 | 6 | 8 | 6 |
| N. Y., N | 23 | 53 | 7 | 7 | 8 | 9 | 11 |
| Miss, S | 10 | 12 | 8 | 8 | 9 | 11 | - |
| Fla, S | 6 | 31 | 9 | 6 | 7 | 6 | 8 |
| Montana | 5 | 4 | 10 | 26 | - | - | 23 |
Actual Extent of Illegal Transport or Harboring of Undocumented Immigrants Unknown
There is no reliable data on the actual volume of illegal transport or harboring offenses which occur, as contrasted to their actual prosecution or conviction. We do know that for illegal entry and reentry offenses, the majority of offenders who are caught were never criminally prosecuted. This was true even under the “zero tolerance” period in 2018 when Attorney General Jeff Sessions instructed U.S. Attorneys Offices to prosecute all illegal entry/reentry offenses.
As TRAC previously reported, in April 2018 CBP referred less than one in four adults apprehended at the border for prosecution. By May of 2018, that percentage rose to one out of every three, and rose further to just under half in June of 2018. The trend in lower-than-promised prosecution rates continued into 2019, when TRAC found that prosecutions of adults traveling alone had fallen by February 2019 to 38 percent of CBP southwest border apprehensions.
It is also clear that trends for prosecutions under 1324 do not necessarily mirror those under 1325 and 1326 for illegal entry and reentry despite the active role smugglers often play in transport and harboring to facilitate illegal entry and reentry. For contrasting trends under these three different statutes, see TRAC’s earlier report.
Given the large number of undocumented immigrants who have illegally entered the country, often with the assistance of others, as well as those who reside in this country but have overstayed their visa and have become undocumented, it appears likely that only a small fraction of these illegal transport and harboring offenses are ever criminally prosecuted. Even shortly after the passage of the Immigration Reform and Control Act of 1986, when large numbers of undocumented immigrants were allowed to become lawful residents, official estimates suggest at least several million remained unlawfully present in the country. Since then, the number of undocumented persons has grown and is generally estimated to be over ten million.[3]
Thus, over the years as is true for most crimes, the decision as to whether or not to bring criminal charges under 8 U.S.C. 1324 has been primarily governed by the priorities assigned to prosecuting this offense over others by federal immigration enforcement agencies and prosecutors.