New Data on ICE Immigrant Detainers Show Sharp Drop Since Start of Biden Administration
Published June 20, 2023
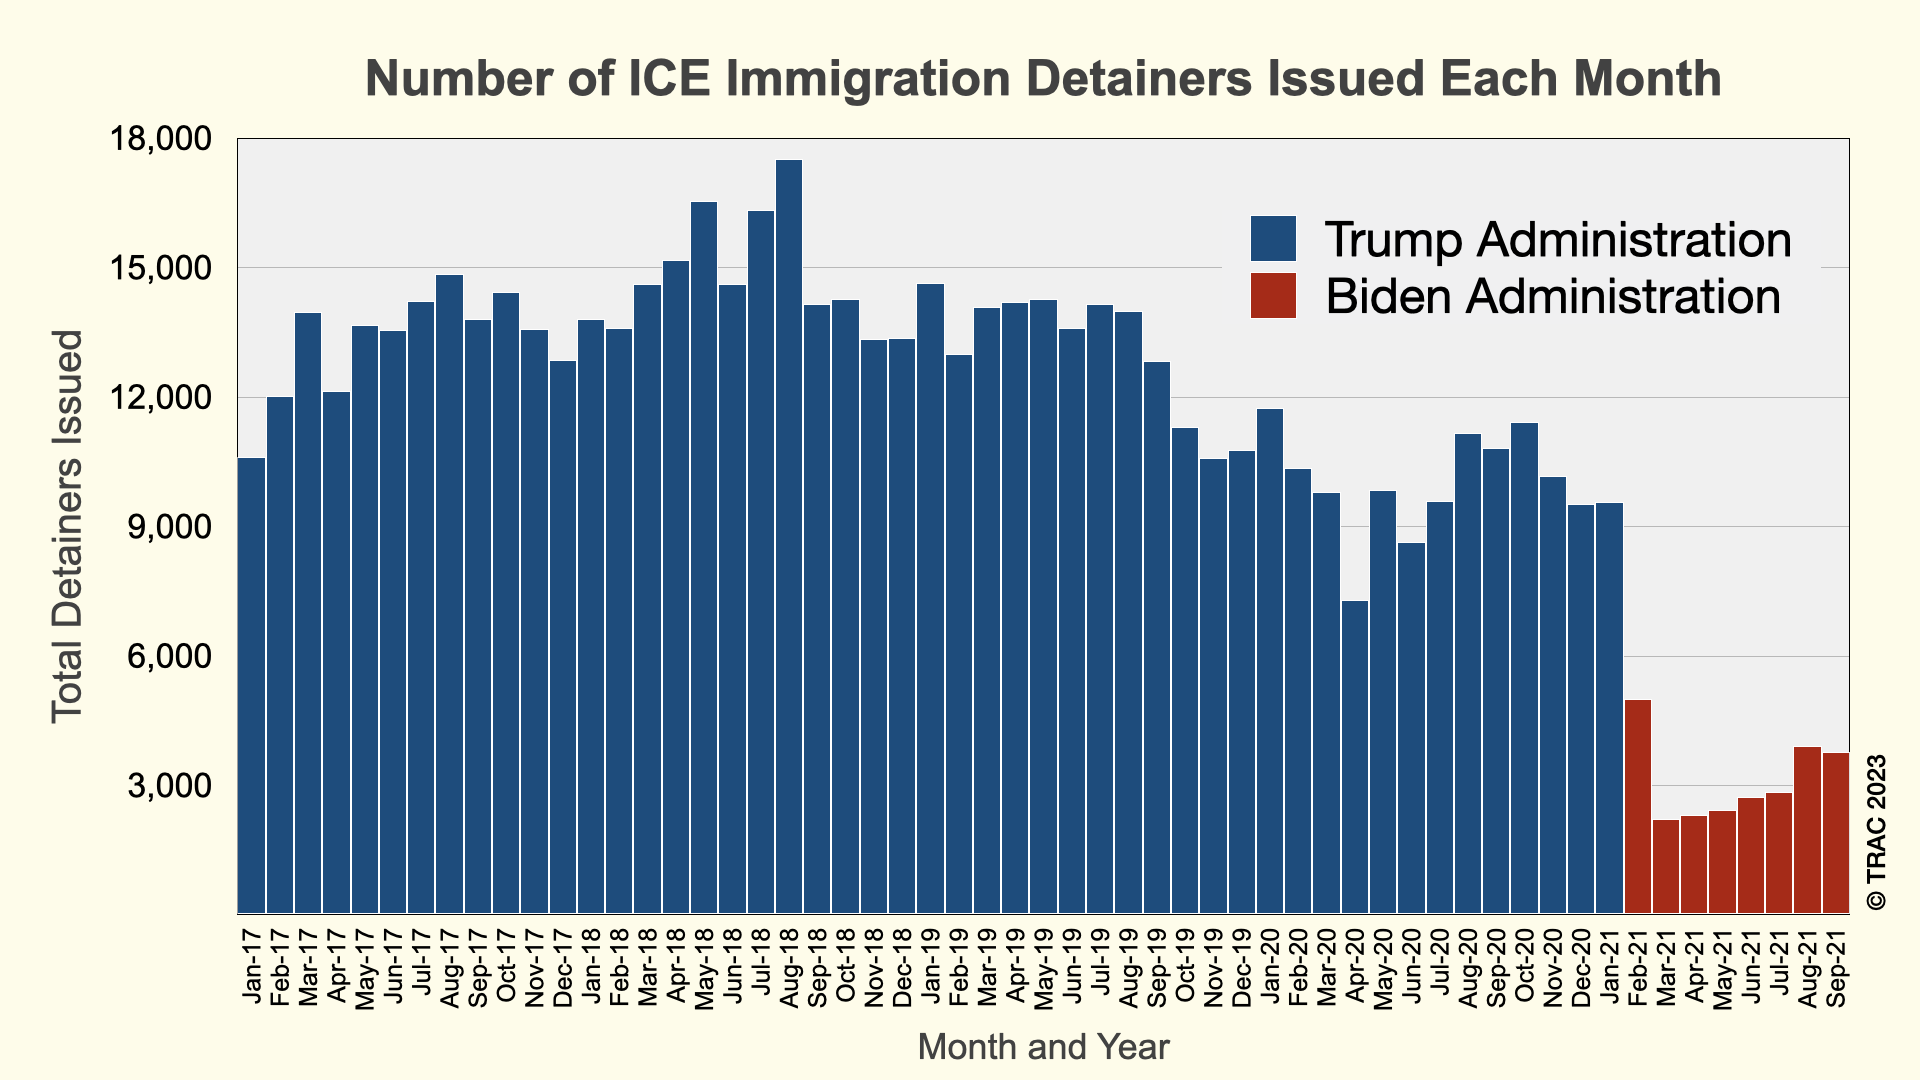
According to the latest records received from Immigration and Customs Enforcement (ICE), the number of immigrant detainers sent to local law-enforcement agencies declined considerably at the start of the Biden administration. See Figure 1.
Monthly detainer usage during the Trump administration climbed above 15,000 for three months during 2018, but generally averaged between 13,000 to 14,000 each month before falling during FY 2020 to around 10,000 (with a temporary dip at the beginning of the COVID-19 partial government shutdown).
It fell sharply once President Biden assumed office, falling to 2,200 by March of 2021. Usage has climbed slightly since that low and reached 3,782 during September 2021.
ICE Detainers vs. ICE Interior Arrests
ICE describes a detainer as a request to a “law enforcement agency to notify ICE before a removable individual is released from custody and to maintain custody of the non-citizen for a brief period of time so that ICE can take custody of that person.” ICE has long claimed that detainers, often called "immigration holds," are an essential tool needed to apprehend and deport individuals not authorized to remain in the U.S. ICE detainers are often used as one indicator of the intensity of what is called “interior enforcement” in contrast to “border enforcement” conducted by ICE’s peer agency, Customs and Border Protection (CBP).
However, the preparation and issuance of a detainer by ICE does not mean that ICE actually took the person into custody. Available historical data from ICE’s internal records obtained by TRAC showed that even during the height of detainer use under President Obama’s implementation of the Secure Communities program, the role of detainers in the arrest and removal of non-citizens appears to have been surprisingly modest. See TRAC November 7, 2017, report. Detainer-by-detainer data up through November 2015 obtained by TRAC indicated at the beginning of FY 2016 (Oct-Nov 2015) ICE actually took the individual into custody only 35 percent of the time. See TRAC’s Historical Detainer Tool.
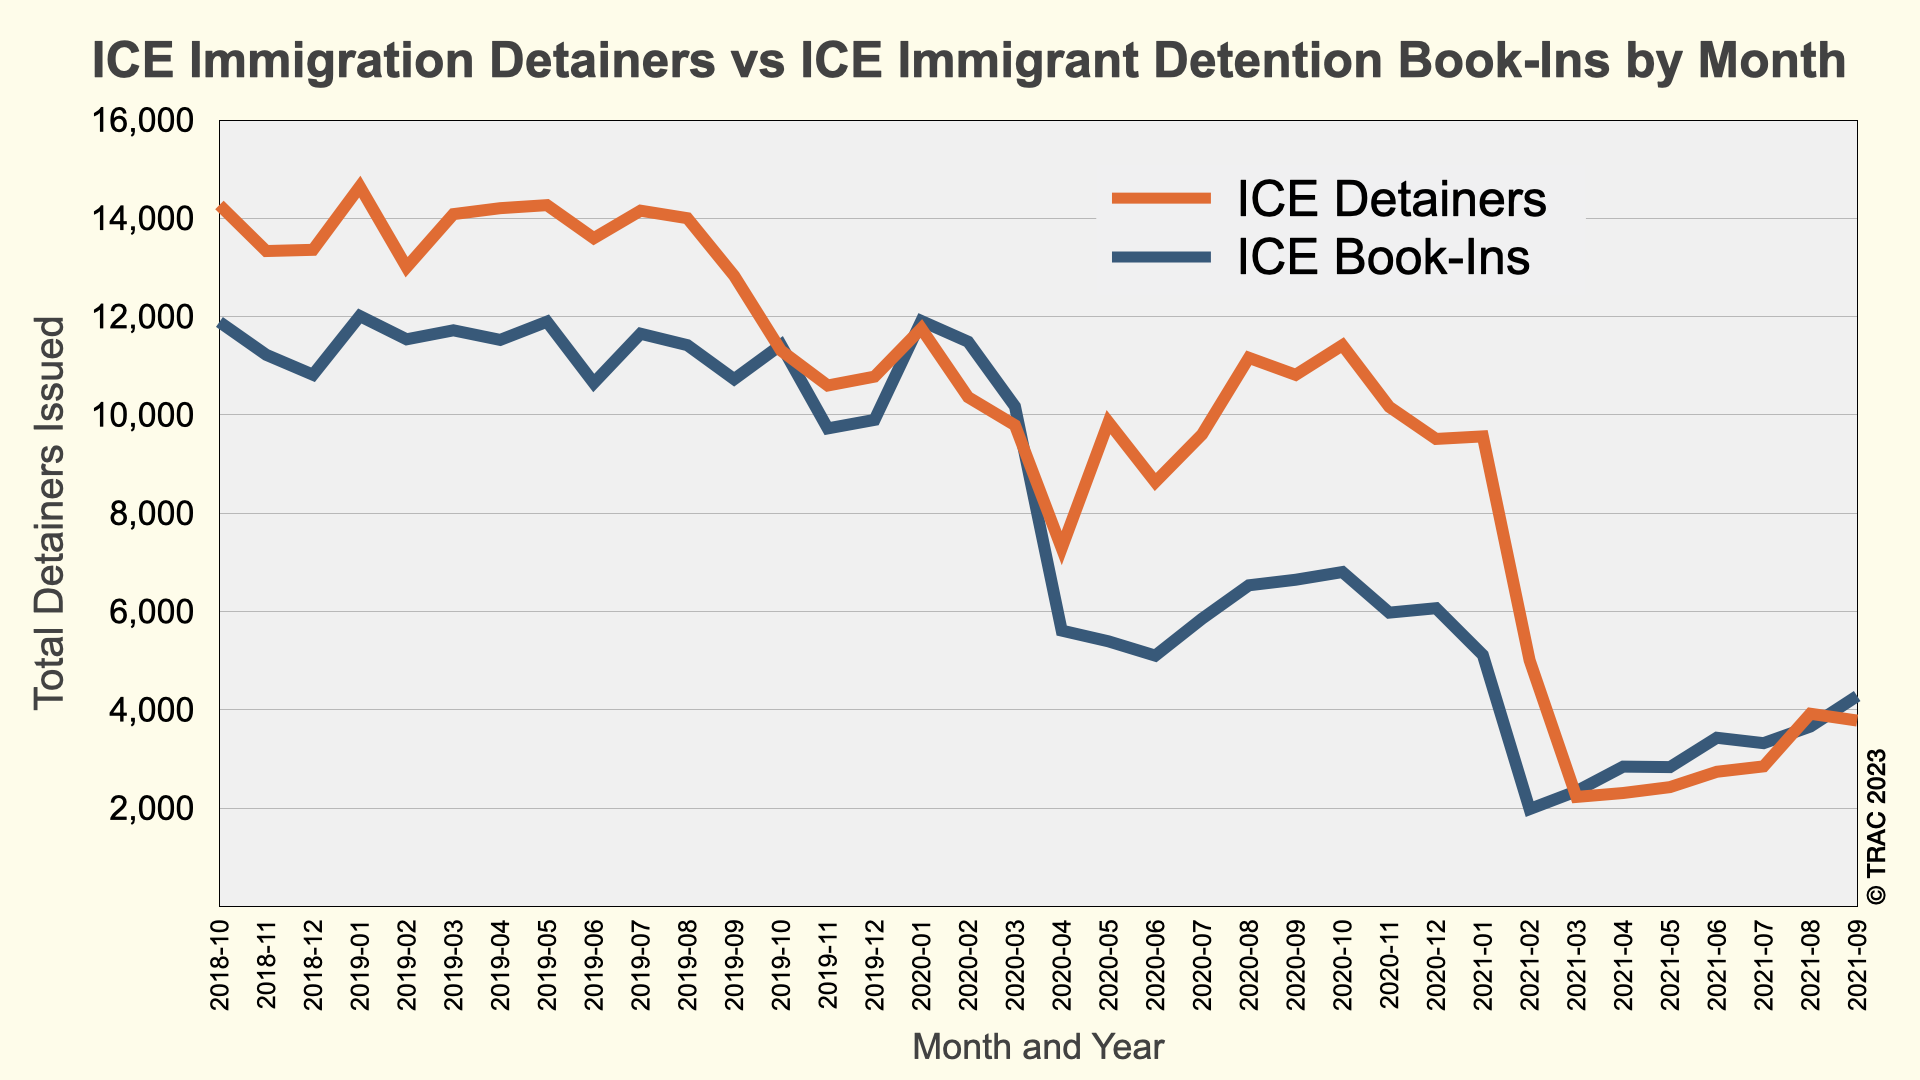
For more recent periods, ICE has refused to release whether ICE actually sought to take subjects into custody, or actually assumed custody. While use of detainers is only one source for ICE interior arrests, a comparison of aggregate numbers of ICE detainers prepared each month with the total number of ICE interior arrests from all sources, shows that just as occurred during the Obama administration, under President Trump many more detainers continued to be issued than the number of individuals ICE actually took into custody. (Information on how many of these detainers were honored or refused by local agencies does not appear to be reliably kept by the agency.[1])
The Biden administration marked an abrupt change in these patterns. Between March and September 2021, not only did the use of detainers fall dramatically, but their numbers are now running below the total number of ICE interior arrests from all sources.[2] See Figure 2 for monthly comparison of the number of detainers issued compared to the number of reported book-ins to immigrant detention facilities between FY 2018 and 2021.
Detainer Usage Since FY 2003 by Presidential Administration
TRAC’s prior data on ICE detainers went through June 2020, and our previous report examined the brief drop in detainers at the start of the COVID-19 pandemic. The current report uses new detainer data current through the end of FY 2021 (September 2021), providing a detailed portrait of detainer usage across the sweep of nearly two decades. These data are now also available to the public in TRAC’s Detainer Tool.
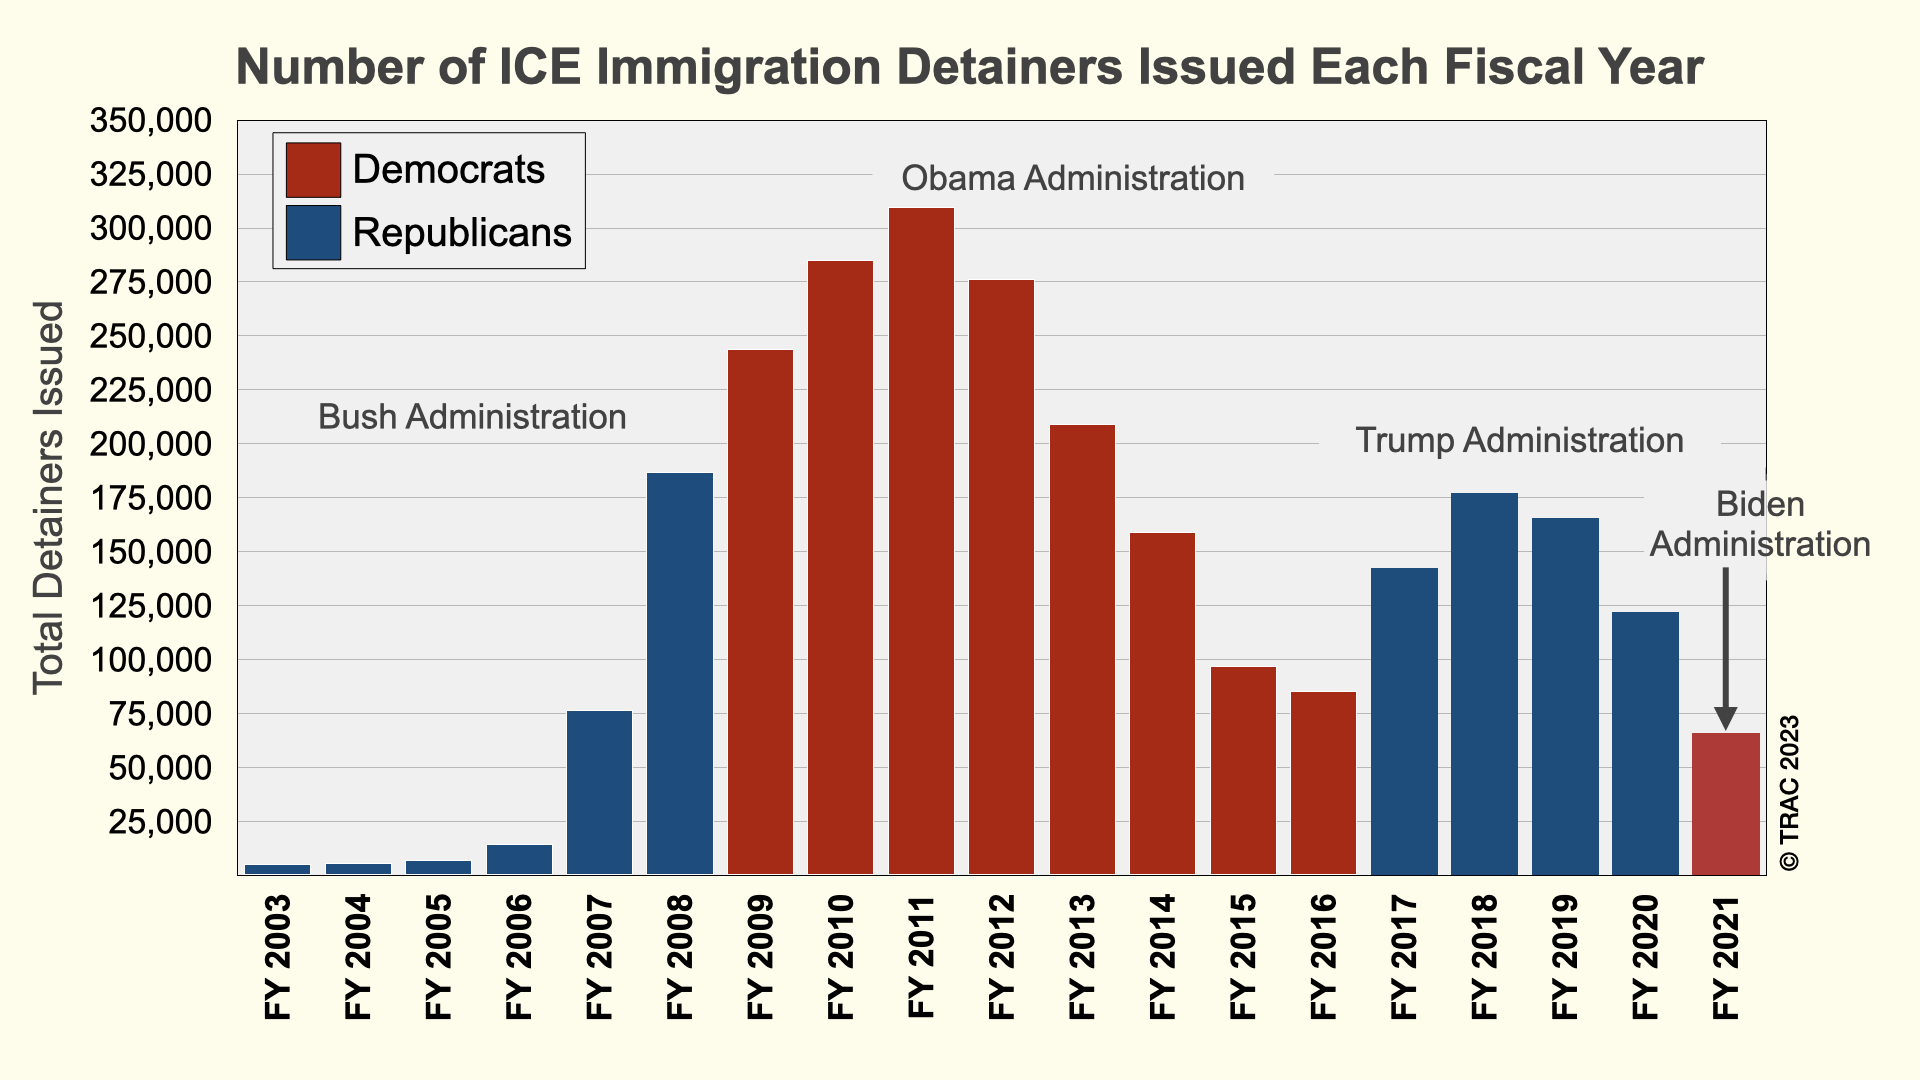
The most aggressive period of detainer use came during the Obama administration. Figure 3 shows the number of detainers issued each fiscal year with presidential administrations and party affiliations highlighted. Notably, although the recent drop in detainers has taken place under a Democratic administration, detainer use does not map directly onto partisan affiliation.
Nationality of Detainers
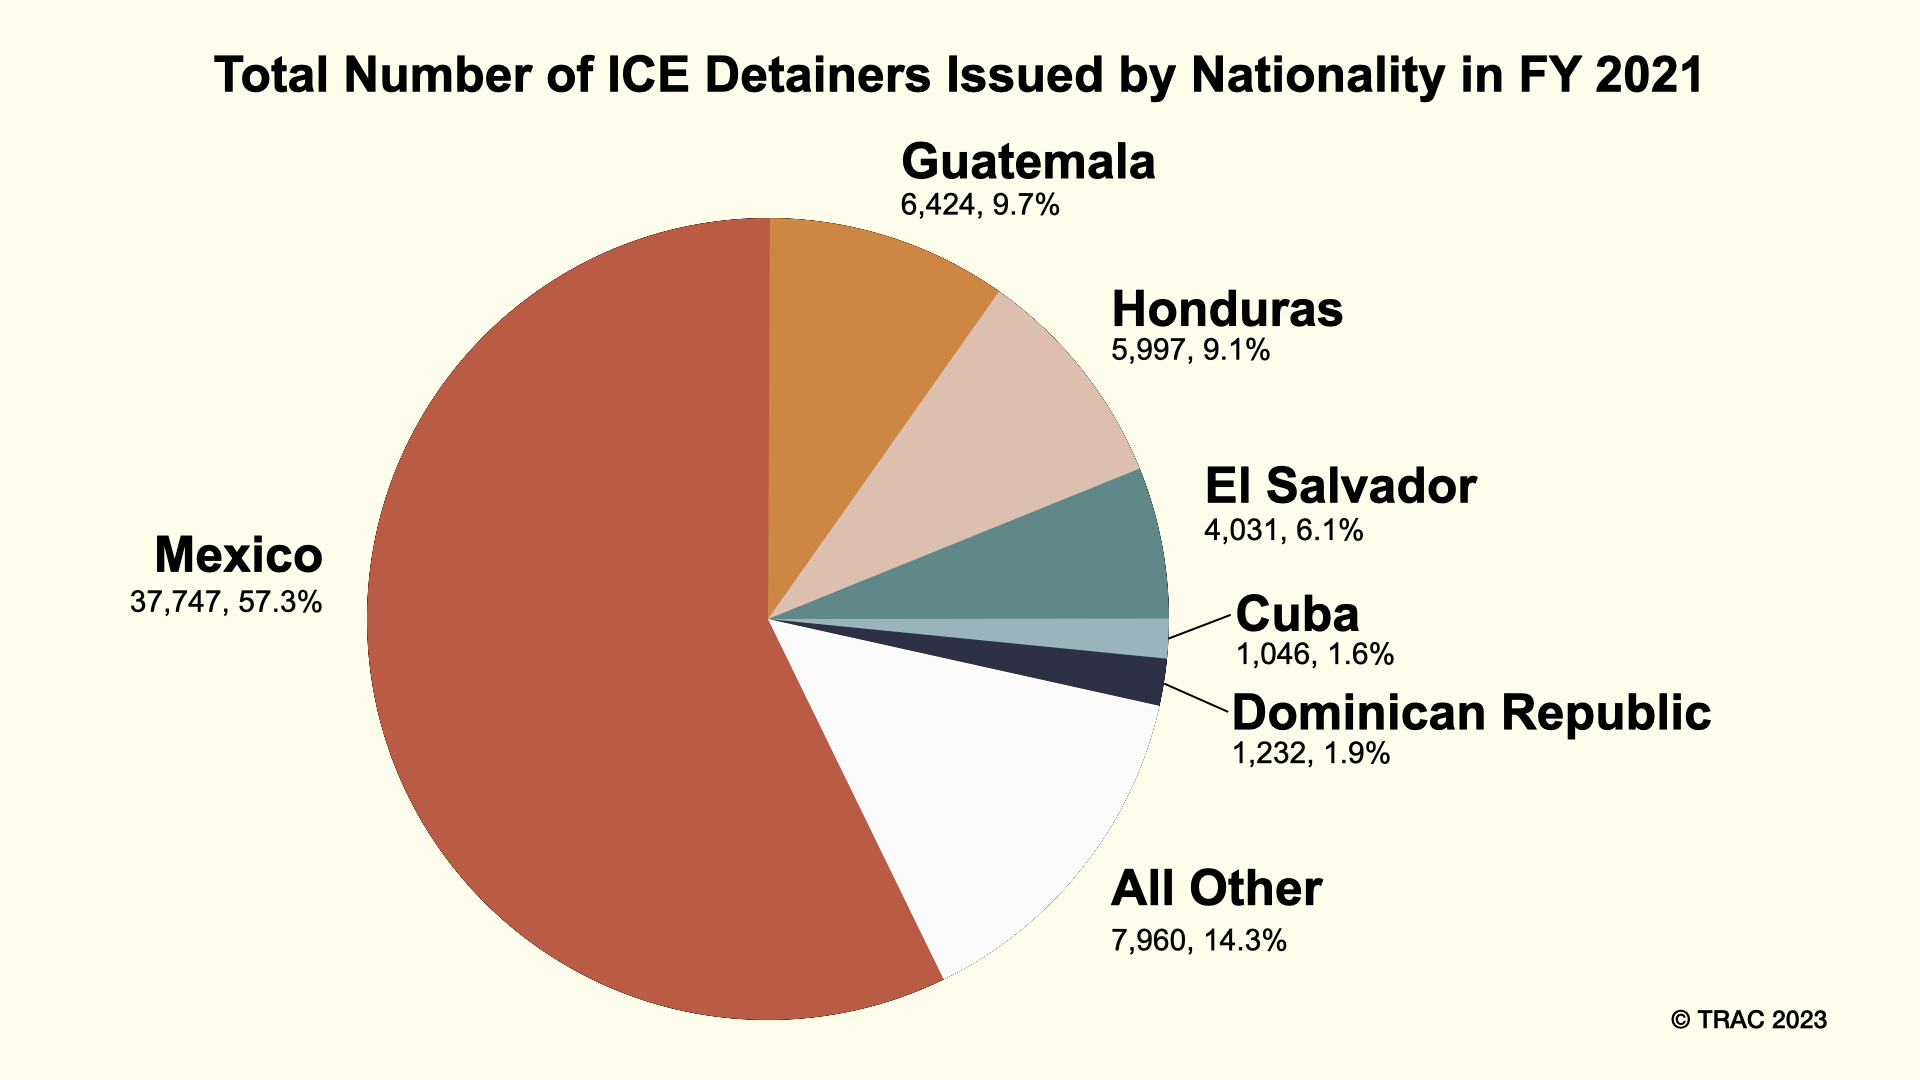
ICE’s data show some 235 different nationalities are represented in the 2.6 million detainers issued since FY 2003. Six nationalities make up at least one percent or more of the total detainers—including Mexico, Guatemala, Honduras, El Salvador, Cuba, and the Dominican Republic.
ICE has issued over two-thirds of all detainers (69%) since 2003 on Mexican nationals, although this percentage has been falling. In FY 2008, Mexican nationals made up 75 percent of all detainers, but by 2021, this had fallen to 57 percent—still a majority, but noticeably lower than in past years. Mexico was listed as the citizenship for 37,747 individuals on whom detainers were issued in FY 2021.
Nationals from Central American countries fell behind Mexico but have been increasing as a fraction of the total. Guatemala made up 6.2 percent of all detainers, but 9.7 percent in 2021. Honduras made up 5.6 percent of all detainers, but 9.1 percent in 2021. El Salvador made up 4.8 percent of all detainers, but 6.1 percent in 2021. Of the detainers issued in FY 2021, Guatemala was listed as the nationality on 6,424, Honduras on 5,997, and El Salvador on 4,031.
The Caribbean countries of Cuba and the Dominican Republic are below Central Americans, with Cubans and Dominicans at 1.5 percent and 1.4 percent, respectively, of all detainers. Of the detainers issued in FY 2021, Cuba was listed as the nationality on 1,046 and the Dominican Republic was listed on 1,232. See Figure 4.
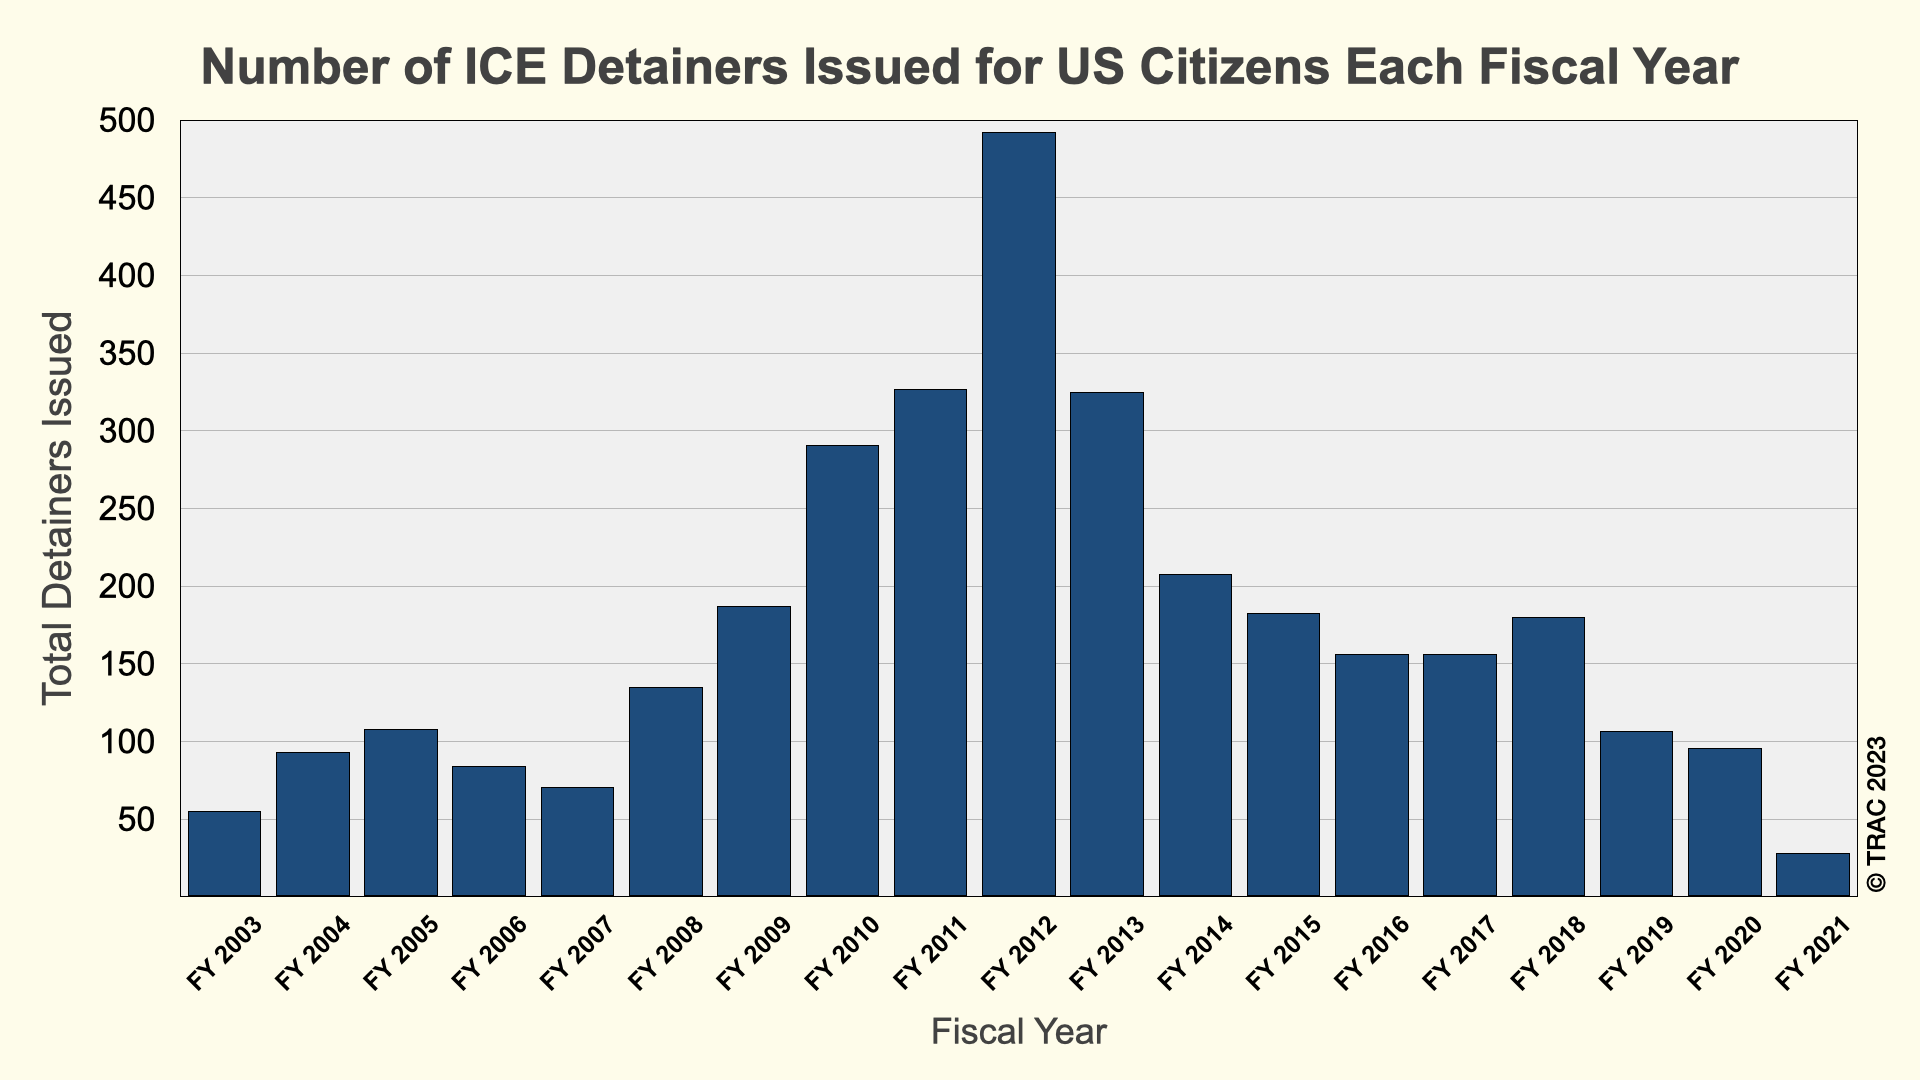
Notably, a small but not insignificant number of detainers are issued each year to what was recorded by ICE as U.S. citizens. See Figure 5. Trends for these mirrored overall detainer trends and represent a very small percent of total detainers issued. The highest year was in FY 2012 during the Obama administration when nearly 500 detainers were recorded as issued against U.S. citizens, and then fell to just over 150 at the end of his term. During the Trump administration, detainers issued for persons recorded as U.S. citizens rose only slightly to 180 during FY 2018 and since then have steadily declined. By FY 2021 the number had fallen to 28, averaging just 2 per month since the Biden administration assumed office.
Facilities Sent ICE Detainers
Most of ICE’s detainers—1.6 million out of the total of 2.6 million—were sent to county facilities, typically to county jails. An additional 250,000 were sent to city jails. Just under 300,000 were sent to federal prisons or other facilities, and another roughly 300,000 went to state facilities. Individuals in federal or state prisons are usually serving their sentence, and ICE issues a detainer asking that the individuals rather than being released at the end of their term be turned over to ICE’s custody. In some earlier years, a larger percentage (up to 16%) of ICE’s detainer records lacked a clear indication of where it was sent, but since FY2017, the percent of “unknowns” has declined to less than two percent.
A few facilities stand out as receiving large numbers of detainers. In FY 2021, the county jail in Harris County, Texas received the most—a total of 2,184 detainers despite ending an immigration enforcement contract with ICE in 2017. The Maricopa County jail in Arizona, received the second most at 942. In third place was the Hidalgo County Jail in Texas. A total of 870 ICE detainers were recorded as addressed to that jail.
Many counties with large populations have more than one facility that receives detainers. Although detainers are most associated with interior enforcement, it is worth noting that many of the jurisdictions that receive the most detainers are nonetheless located in the southern border states of California, Arizona, New Mexico, and Texas.