A National Assessment of the Biden Administration’s Dedicated Docket Initiative
Published Dec 6, 2022
The Immigration Court’s Dedicated Docket (DD) program was created by the Biden administration to speed the processing of families seeking asylum after arriving along the Southwest Border. Over 110,000 DD cases covering each individual in these families have now been assigned to this initiative. To determine how this program is working, this report follows this cohort of cases.[1] A total of nearly 40,000 of these cases have now been closed.
The goal set by the Biden Administration on May 28, 2021, when it announced this new initiative was to issue decisions in these cases within 300 days from their initial master calendar hearing. However, the Administration announced: “While the goal of this process is to decide cases expeditiously, fairness will not be compromised.”
Using detailed case-by-case Immigration Court records, this report is the first full-scale national assessment of whether the program has lived up to these goals. We found in brief:
- Cases did in fact move expeditiously: 83% of closed cases were completed in less than 300 days from the date of the NTA. Cases without attorneys were closed faster than those with attorneys.
- Only 34% found representation in closed cases, falling far short of announced objectives. [2]
- Only 33% were able to file an asylum application in closed cases since the paperwork is difficult to complete without representation.
- Only 7% were granted asylum since even with representation, and after filing asylum applications, families with expedited hearing schedules were much less likely to prevail and be granted asylum.
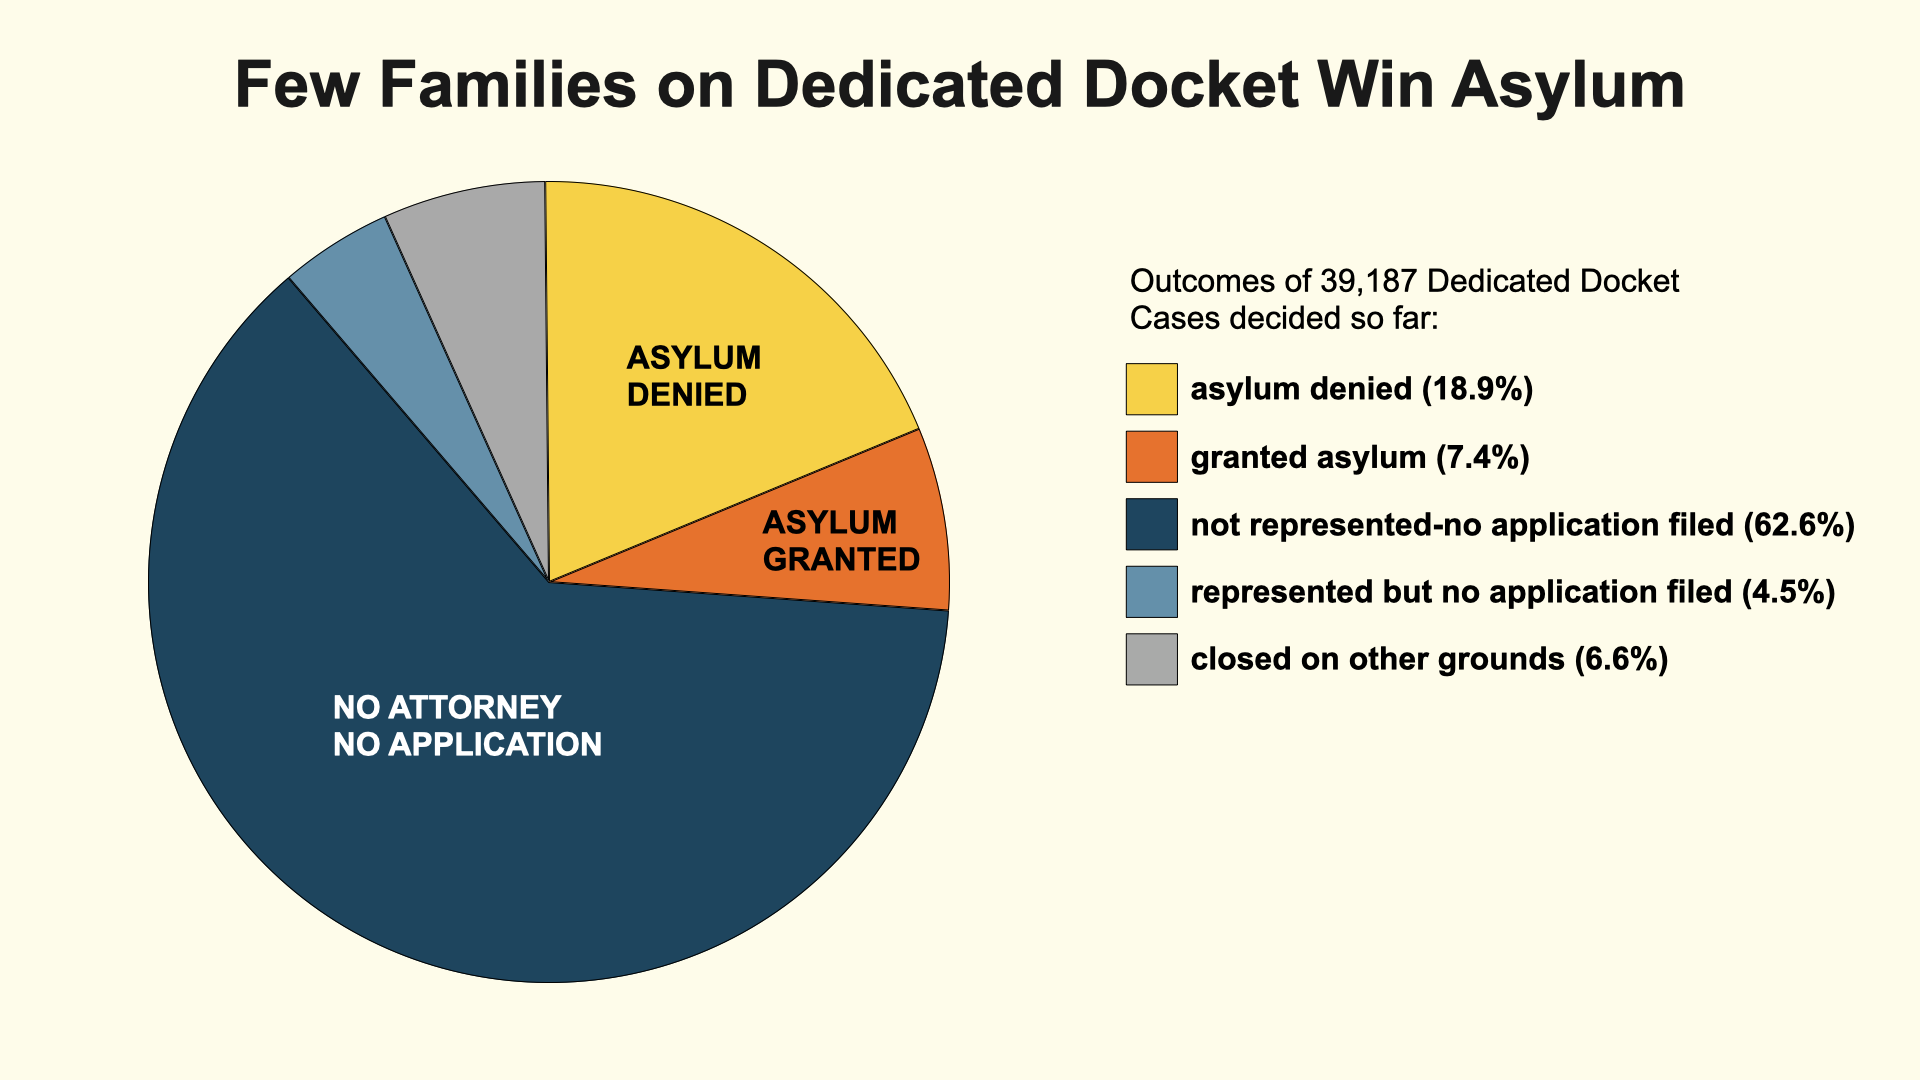
The end result of the Dedicated Docket’s winnowing process was that only 2,894 out of 39,187 closed cases for families assigned to the Dedicated Docket were granted asylum – just 7 percent. At each stage, as discussed in the following sections, expedited hearing processing substantially reduced the odds that families were able to have their asylum claims considered and asylum itself granted. See Figure 1.
TRAC’s analysis of the dismal outcome of Dedicated Docket cases thus far, along with past evaluations of earlier “rocket docket” initiatives,[3] points to there being no quick fix for the country’s asylum backlog. With time and a substantial increase in resources – including more judges, asylum officers, support staff, publicly provided attorneys for asylum seekers and perhaps an independent Article I Immigration Court – the asylum process might become reasonably speedy without sacrificing fairness.
But short of that, the evidence suggests that the United States can implement schemes to make asylum cases fast or make asylum cases fair, but not both. The country needs careful and independent monitoring of this administration’s growing initiatives to expedite asylum cases so the public can judge whether these initiatives live up to their goals and the claims being made as to their “success.”
The Workload of Dedicated Docket Hearing Locations
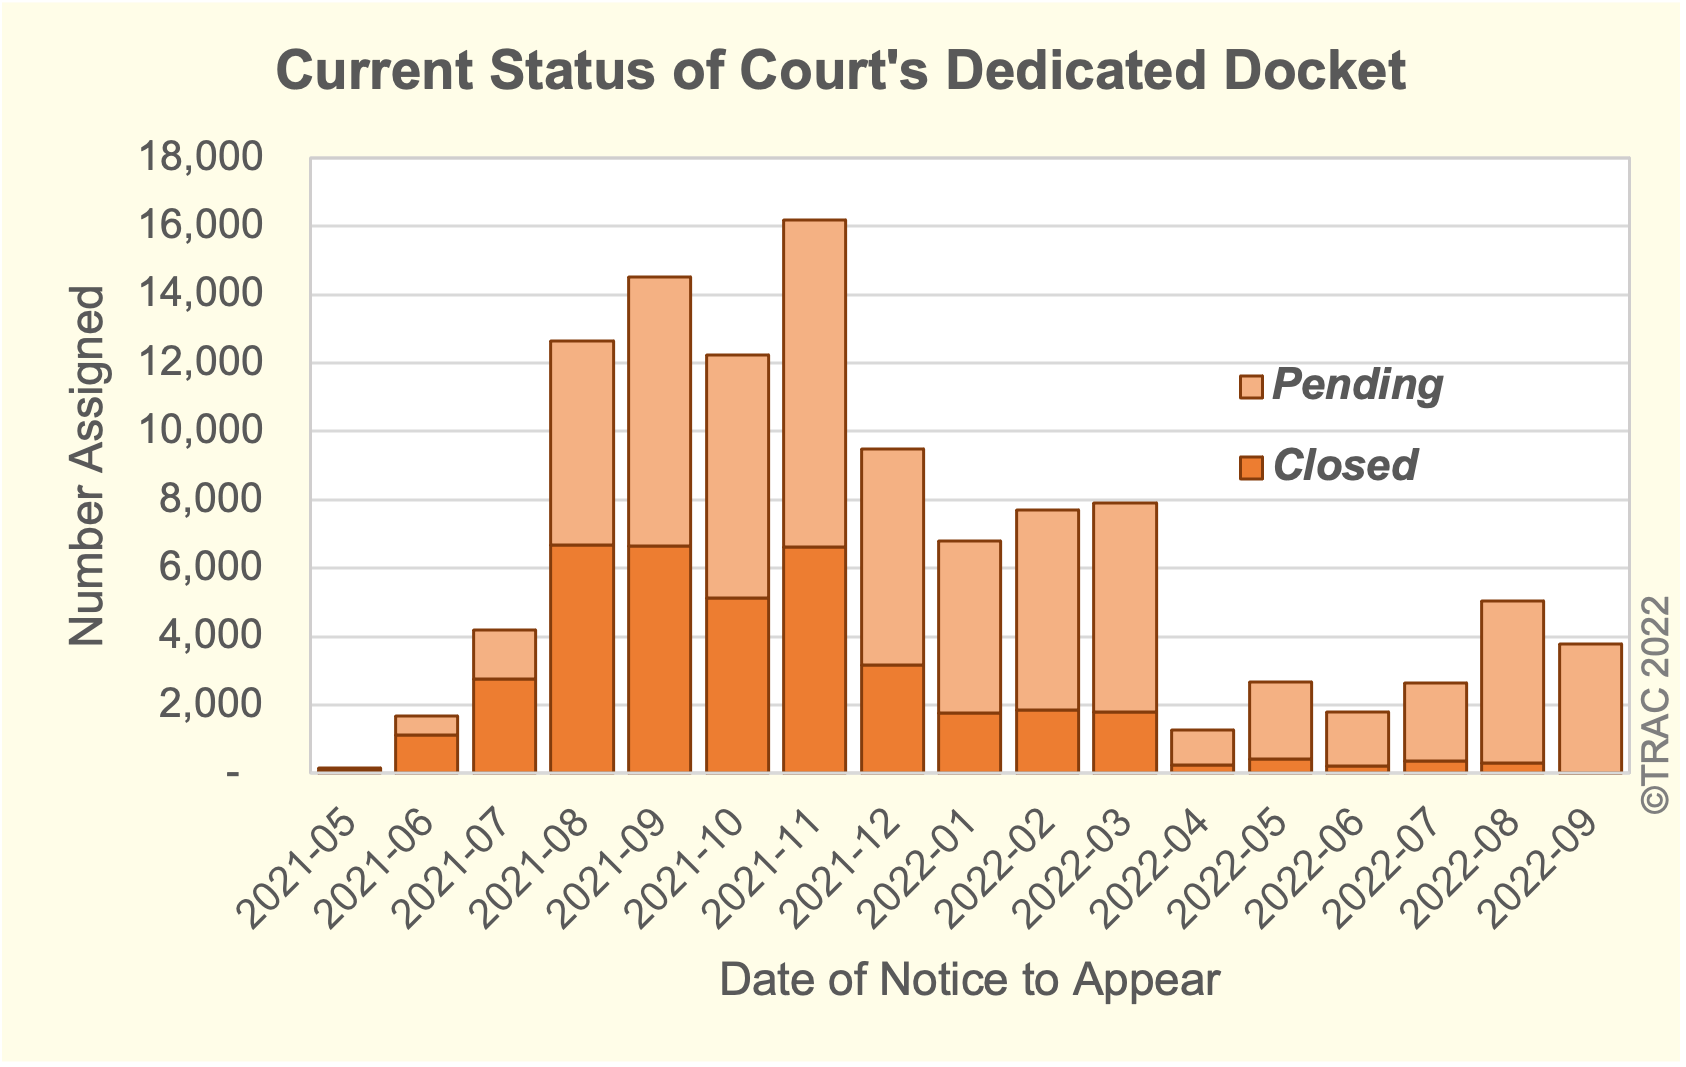
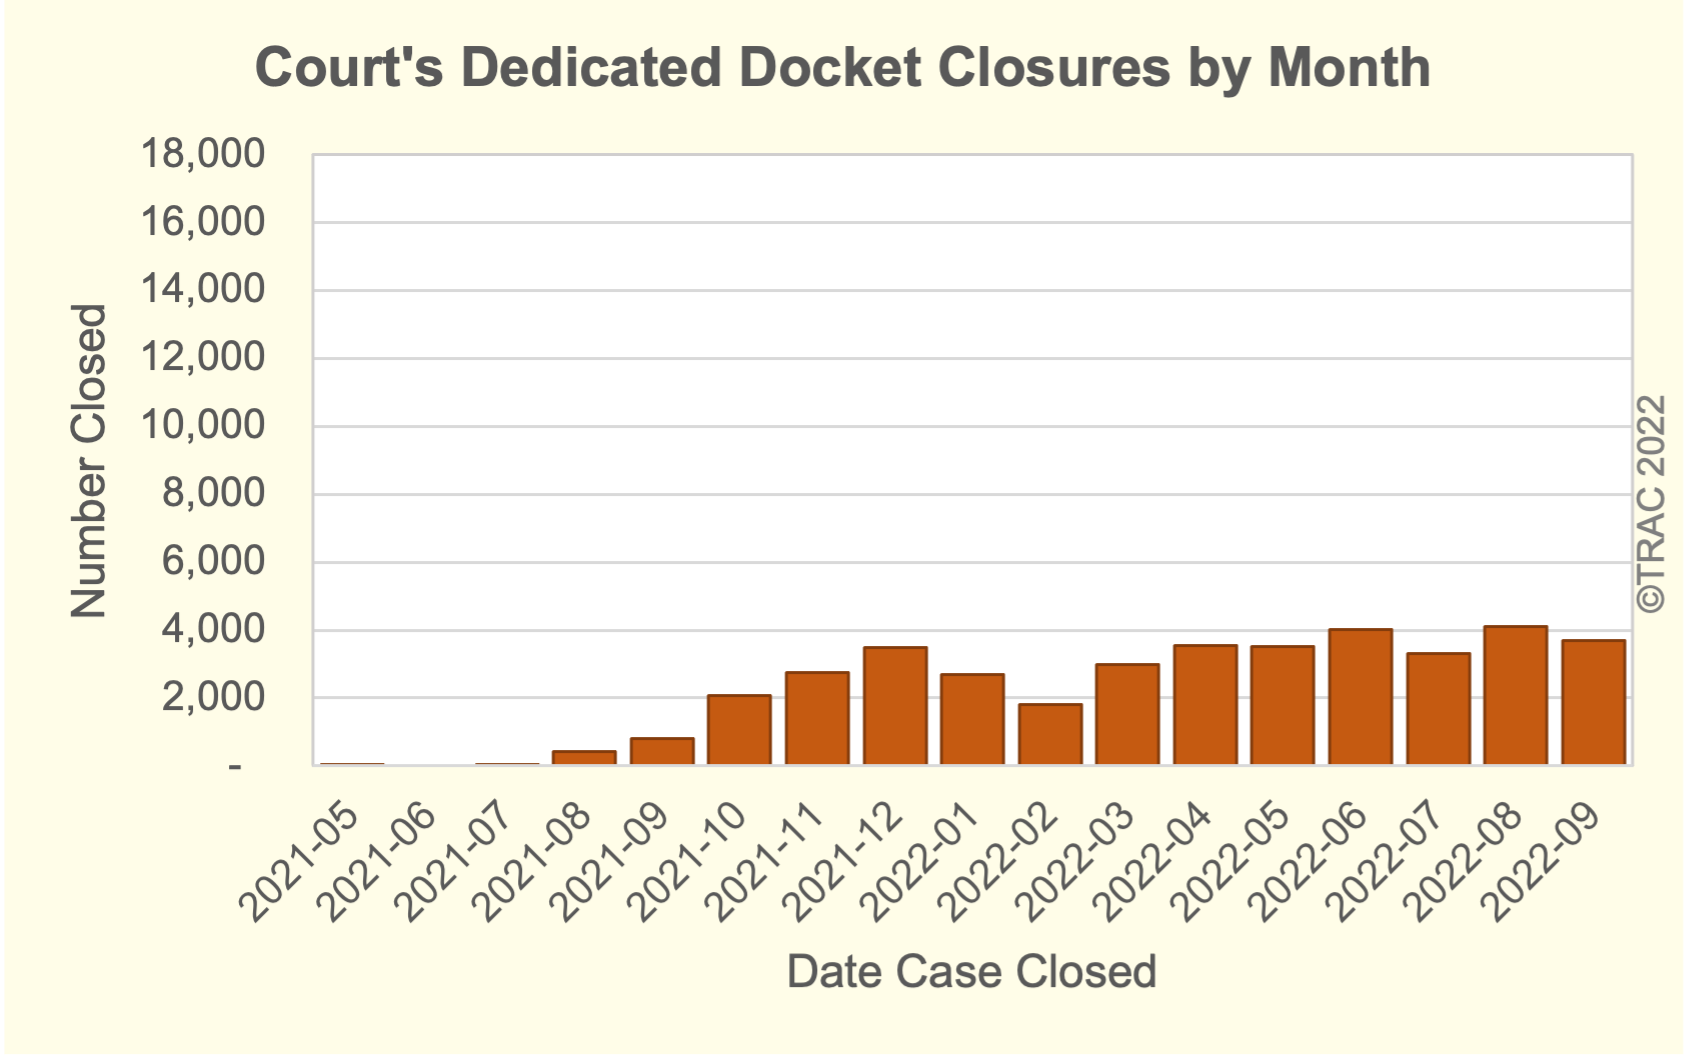
The Biden administration launched the Dedicated Docket at the end of May in 2021. The number of new cases added to the Dedicated Docket grew sharply in the late summer and fall of 2021, then dropped off after March of 2022. By the end of September of this year, a total of 110,708 cases had been filed, although DD assignments actually peaked back in November of 2021. As cases have moved through the courts, the pace of DD case closures has grown with time and is currently around 3,000 to 4,000 per month. See Figures 2 and 3.
Families from 12 countries have dominated those assigned. One out of five (21%) of those assigned were from Brazil. The second and third largest nationalities represented were families from Ecuador (13%) followed by Colombia (9%). The traditional Northern Triangle countries (Guatemala, Honduras, El Salvador) were further down the list and together have made up 19 percent — a comparatively small fraction given how overrepresented these nationalities are throughout the immigration system. See Table 1a.
Despite this overall pattern, the prevalence of certain nationalities has changed over time. While Brazilians were the largest nationality initially, Cuban families surpassed them during the period of January to March of 2022. The percent of DD cases from Colombia then became the most frequent nationality from April to September 2022. See Table 1b.
| Nationality | All Cases | Percent |
|---|---|---|
| All | 110,708 | 100% |
| Brazil | 23,205 | 21% |
| Ecuador | 14,373 | 13% |
| Colombia | 10,029 | 9% |
| Honduras | 8,762 | 8% |
| Cuba | 7,767 | 7% |
| Nicaragua | 7,627 | 7% |
| Venezuela | 7,593 | 7% |
| Haiti | 7,209 | 7% |
| Guatemala | 6,661 | 6% |
| El Salvador | 5,117 | 5% |
| Peru | 4,658 | 4% |
| Chile | 1,537 | 1% |
| Other Countries | 6,170 | 6% |
| Nationality | All Cases | Date of Notice to Appear | Current Status of Case | Percent Closed | |||||
|---|---|---|---|---|---|---|---|---|---|
| FY 2021 | Oct-Dec 21 | Apr-Jun 22 | Jan-Mar 22 | Jul-Sep 22 | Pending | Closed | |||
| All | 110,708 | 33,149 | 37,905 | 22,415 | 5,765 | 11,474 | 71,521 | 39,187 | 35% |
| Brazil | 23,205 | 9,268 | 8,840 | 2,600 | 497 | 2,000 | 17,491 | 5,714 | 25% |
| Ecuador | 14,373 | 7,697 | 3,590 | 2,004 | 318 | 764 | 8,691 | 5,682 | 40% |
| Colombia | 10,029 | 632 | 1,707 | 2,406 | 1,917 | 3,367 | 8,117 | 1,912 | 19% |
| Honduras | 8,762 | 3,138 | 3,788 | 1,408 | 195 | 233 | 4,126 | 4,636 | 53% |
| Cuba | 7,767 | 1,156 | 2,876 | 3,120 | 452 | 163 | 4,296 | 3,471 | 45% |
| Nicaragua | 7,627 | 1,881 | 3,238 | 2,249 | 129 | 130 | 5,035 | 2,592 | 34% |
| Venezuela | 7,593 | 1,502 | 3,732 | 2,049 | 119 | 191 | 4,530 | 3,063 | 40% |
| Haiti | 7,209 | 1,844 | 2,504 | 2,107 | 323 | 431 | 3,999 | 3,210 | 45% |
| Guatemala | 6,661 | 2,799 | 2,457 | 1,053 | 159 | 193 | 3,279 | 3,382 | 51% |
| El Salvador | 5,117 | 1,509 | 2,326 | 926 | 141 | 215 | 2,807 | 2,310 | 45% |
| Peru | 4,658 | 200 | 841 | 807 | 960 | 1,850 | 4,002 | 656 | 14% |
| Chile | 1,537 | 373 | 642 | 412 | 33 | 77 | 967 | 570 | 37% |
| Other Countries | 6,170 | 1,150 | 1,364 | 1,274 | 522 | 1,860 | 4,181 | 1,989 | 32% |
Initially, there were ten cities where families on the Dedicated Docket were sent to attend their hearings. Over time, this number expanded to twelve. However, caseloads were not distributed evenly among these Dedicated Docket locations. The El Paso DD hearing location is currently responsible for the smallest number of cases with just 398, while four locations – Boston, Newark, Miami and New York City – each have 10,000 or more. See Table 2.
Nationality groups also ended up concentrated in specific locations. Based on current court records, for example, the Boston DD hearing location has been assigned the largest number with 20,282 persons on their Dedicated Docket. Seven out of ten of these families are from Brazil. Miami has concentrations of Cubans, Venezuelans, and Haitians. See Table 3.
| Hearing Location | All Cases | Date of Notice to Appear | Current Status of Case | Percent Closed | |||||
|---|---|---|---|---|---|---|---|---|---|
| FY 2021 | Oct-Dec 21 | Apr-Jun 22 | Jan-Mar 22 | Jul-Sep 22 | Pending | Closed | |||
| All | 110,708 | 33,149 | 37,905 | 22,415 | 5,765 | 11,474 | 71,521 | 39,187 | 35% |
| Boston | 20,282 | 6,992 | 7,633 | 1,968 | 590 | 3,099 | 16,086 | 4,196 | 21% |
| Newark | 16,365 | 5,513 | 4,918 | 3,003 | 840 | 2,091 | 12,614 | 3,751 | 23% |
| Miami | 14,723 | 3,083 | 6,986 | 3,758 | 346 | 550 | 3,654 | 11,069 | 75% |
| New York City | 10,847 | 6,292 | 2,199 | 773 | 560 | 1,023 | 4,759 | 6,088 | 56% |
| New York City-Broadway | 6,555 | 902 | 2,098 | 2,359 | 278 | 918 | 4,128 | 2,427 | 37% |
| Los Angeles | 6,268 | 1,808 | 2,068 | 878 | 412 | 1,102 | 2,096 | 4,172 | 67% |
| San Francisco | 5,753 | 1,530 | 1,866 | 918 | 538 | 901 | 3,390 | 2,363 | 41% |
| Denver | 2,710 | 848 | 733 | 452 | 372 | 305 | 1,227 | 1,483 | 55% |
| Seattle | 2,254 | 772 | 576 | 420 | 144 | 342 | 1,042 | 1,212 | 54% |
| San Diego | 944 | 360 | 249 | 140 | 97 | 98 | 431 | 513 | 54% |
| Detroit | 778 | 205 | 228 | 90 | 93 | 162 | 459 | 319 | 41% |
| El Paso | 398 | 103 | 126 | 69 | 34 | 66 | 107 | 291 | 73% |
| Non-DD Court | 22,831 | 4,741 | 8,225 | 7,587 | 1,461 | 817 | 21,528 | 1,303 | 6% |
| Nationality | All | Boston | Newark | Miami | New York City | NYC-Broadway | Los Angeles | San Francisco | Denver | Seattle | San Diego | Detroit | El Paso | Non-DD Court |
|---|---|---|---|---|---|---|---|---|---|---|---|---|---|---|
| All | 110,708 | 20,282 | 16,365 | 14,723 | 10,847 | 6,555 | 6,268 | 5,753 | 2,710 | 2,254 | 944 | 778 | 398 | 22,831 |
| Brazil | 23,205 | 14,691 | 4,007 | 1,628 | 132 | 73 | 26 | 232 | 37 | 560 | 49 | 13 | 0 | 1,757 |
| Ecuador | 14,373 | 917 | 3,575 | 39 | 5,937 | 2,961 | 28 | 12 | 21 | 15 | 13 | 6 | 0 | 849 |
| Colombia | 10,029 | 690 | 1,683 | 884 | 810 | 868 | 1,248 | 1,256 | 707 | 217 | 30 | 171 | 23 | 1,442 |
| Honduras | 8,762 | 483 | 1,566 | 1,057 | 877 | 595 | 883 | 875 | 653 | 419 | 45 | 236 | 116 | 957 |
| Cuba | 7,767 | 8 | 27 | 3,220 | 6 | 0 | 26 | 0 | 23 | 13 | 0 | 6 | 67 | 4,371 |
| Nicaragua | 7,627 | 46 | 77 | 908 | 187 | 27 | 500 | 402 | 252 | 83 | 13 | 10 | 13 | 5,109 |
| Venezuela | 7,593 | 121 | 90 | 2,076 | 204 | 38 | 121 | 80 | 130 | 85 | 9 | 16 | 96 | 4,527 |
| Haiti | 7,209 | 965 | 1,051 | 3,066 | 392 | 334 | 17 | 37 | 20 | 37 | 471 | 49 | 0 | 770 |
| Guatemala | 6,661 | 771 | 1,003 | 660 | 411 | 252 | 1,162 | 945 | 263 | 203 | 130 | 143 | 21 | 697 |
| El Salvador | 5,117 | 454 | 560 | 149 | 435 | 316 | 1,111 | 884 | 260 | 171 | 12 | 32 | 16 | 717 |
| Peru | 4,658 | 152 | 1,954 | 165 | 472 | 419 | 284 | 407 | 146 | 93 | 21 | 2 | 3 | 540 |
| Chile | 1,537 | 200 | 253 | 584 | 74 | 90 | 8 | 13 | 7 | 8 | 68 | 9 | 1 | 222 |
| Other Countries | 6,170 | 784 | 519 | 287 | 910 | 582 | 854 | 610 | 191 | 350 | 83 | 85 | 42 | 873 |
The Shuffle of Dedicated Docket Cases Between Hearing Locations and Judges
The current court assignment for families on the Dedicated Docket does not necessarily reflect their original assignment. During the course of the program, a surprising volume of transfers have occurred.[4] Indeed, despite a 53 percent increase in overall Dedicated Docket cases over the last nine months, some hearing locations have actually had a net loss in cumulative caseloads because large numbers of cases were transferred out to other DD hearing locations as well as to non-DD hearing locations. See Table 4.
At the end of December 2021, for example, the Miami Dedicated Docket recorded 15,786 assigned cases. Despite a continuing flow of new cases to Miami (as previously shown in Table 2), at the end of September 2022 the case totals there on its Dedicated Docket – both pending and closed -- had dropped to 14,723.
A further shuffling of cases appears to have occurred for the New York City DD hearing location when a second DD hearing location in New York City was established. Between December 2021 and September 2022, the original NYC DD hearing location had a net decline of 17 percent in its caseload even though new cases continued to be assigned there, indicating that the outflow of cases (i.e. case transfers) exceeding newly assigned cases.
And while through calendar year 2021 just 2,055 (3%) of individuals originally assigned to the Dedicated Docket were recorded at non-DD hearing locations, [5] nine months later one in five of the individuals (22,831 or 21%) had been transferred by the Court to non-DD hearing locations.
A transfer to a new hearing location also meant a different judge was assigned responsibility for the case. However, those at the same DD hearing location also experienced frequent judge changes. A relatively small number of judges were initially assigned to hear these cases. TRAC found only six judges accounted for nearly two-thirds of the DD cases assigned by the end of August 2021. When DD cases were added to one judge’s existing workload, for example, the judge's total workload rose to 6,896 cases – an impossible load for DD cases to be handled quickly. At a number of DD hearing locations, this led to juggling judge assignments for a given family as these courts struggled to handle required master and individual hearings expeditiously.
| Assigned Hearing Location | DD Cases as of: | Net Change | |
|---|---|---|---|
| Dec 31,2021 | Sep 30,2022 | ||
| All Dedicated Docket Cases | 72,289 | 110,708 | 53% |
| DD Hearing Location | 70,234 | 87,877 | 25% |
| Miami | 15,786 | 14,723 | -7% |
| Boston | 14,939 | 20,282 | 36% |
| New York City | 12,996 | 10,847 | -17% |
| Newark | 11,487 | 16,365 | 42% |
| New York City-Broadway | - | 6,555 | - |
| Los Angeles | 5,434 | 6,268 | 15% |
| San Francisco | 3,909 | 5,753 | 47% |
| Denver | 2,364 | 2,710 | 15% |
| Seattle | 1,597 | 2,254 | 41% |
| San Diego | 707 | 944 | 34% |
| Detroit | 673 | 778 | 16% |
| El Paso | 342 | 398 | 16% |
| Non-DD Hearing Location | 2,055 | 22,831 | 1011% |
TRAC Finds EOIR Data Management Issues with Dedicated Docket Cases
Although it would be valuable to track precisely how often transfers between hearing locations have taken place over the course of this program, this is not possible for Dedicated Docket cases. This is unusual. Normally, this would be possible for TRAC to do this analysis because each record in EOIR’s database for any case assigned to a hearing location is also assigned a unique ID. When a case is transferred to a new hearing location, normally a new proceeding record with a new unique ID is created in order to track proceedings at that hearing location.
However, when an exact proceeding-by-proceeding match was done of the database records TRAC received at the end of December 2021 with the records received at the end of September 2022, their entries were no longer the same. For 17 percent of these cases, EOIR appears to have simply written over the original location with the new location, effectively destroying the original entry in its official master database. Thus, the fact that the family had previously been sent to entirely different hearing location has been lost through data erasure. [6] In addition, 687 cases were now no longer present in the Court’s master database files – they had been inexplicably deleted despite the fact that hearings had been scheduled and even taken place for those families. But now no record for them existed.[7]
These erasures also occurred for changes in judge assignments. When TRAC compared records at just these two points in time, the judge assignments for the same exact proceeding were different for nearly half (45%) of the families. Again, because the name of the judge assigned had simply been written over the EOIR’s data no longer contained a proper record of not just this recent change but also any of the prior changes in judges who may have been officially assigned to the family’s case.
The EOIR has not been transparent about the degree of case transfers, including (1) transfers from DD to non-DD hearing locations, (2) transfers from one DD hearing location to another, and (3) from one Immigration Judge to another. The administration’s announced goals had been to minimize this degree of case shuffling[8] because it is widely acknowledged to be wasteful of the Court’s time, not to mention imposing extra burdens on the families seeking asylum and for their attorneys.
The Court has also not been transparent about the criteria used for initially assigning families to a Dedicated Docket, nor the consistency in their application by CBP officials stationed at different locations along the border. For instance, buried in a footnote to a table EOIR has posted reporting Dedicated Docket numbers, it mentions that in April 2022 “DHS determined that Cubans, Venezuelans, and Nicaraguans did not meet the requirements for placement on the dedicated docket. Most Cubans, Venezuelans, and Nicaraguans were subsequently placed on a non-detained docket.”
Consistent with this footnote, many Cubans and Venezuelans who were disproportionately assigned to the Miami Dedicated Docket have now ended up at non-DD hearing locations.[9] TRAC’s analysis (see earlier Table 3) shows that as of the end of September, 56 percent of Cubans and 60 percent of Venezuelans originally assigned to the Dedicated Docket were now assigned to non-DD hearing locations. And fully 67 percent of Nicaraguans had been transferred to non-DD hearing locations.
But TRAC also finds that, while not mentioned by EOIR on this list, court records also show that a smaller but substantial number of Brazilians and Colombians have been transferred to non-DD hearing locations, raising questions about whether a similar decision had been made about these cases.[10]
Dedicated Docket Cases and Expedited Processing Speed
Cases assigned to the Dedicated Docket have generally moved expeditiously, reflecting the Biden administration’s goal of moving these cases to the front of the line and moving them more quickly through the Immigration Courts. The vast majority (83 percent) of completed cases had been closed within 300 days from the date of the NTA.[11]
The average days between the date of the NTA and the date the case was closed, setting aside cases dismissed because DHS failed to file the NTA, was 232 days. El Paso had the shortest closure times at 181 days. New York City had the longest time to closure with an average of 261 days, but still well below the 300-day benchmark. The median number of days across all hearing locations was 239 days. See Table 5.
For cases that are still pending, the average days since the NTA was issued and the end of September was 260 days, with a median of 289 days.
However, median figures mark the middle of the distribution of days that cases are taking, so half of the cases are already taking longer than this median figure. So far, when pending cases and closed cases are considered together, about one-third (36%) of cases have exceeded 300 days. Since the initiative was only launched at the end of May 2021, roughly 16 months have elapsed. It will take more months to assess how often and for how long Immigration Judges allow delays in resolving cases where there may be special difficulties finding representation or particular problems requiring additional time to obtain important documentary and testimonial evidence to support a family’s asylum claims.
| Current Hearing Location | Days to Close | |
|---|---|---|
| Average* | Median* | |
| All | 232 | 239 |
| New York City | 261 | 272 |
| San Diego | 250 | 266 |
| Newark | 247 | 255 |
| Seattle | 240 | 259 |
| Boston | 240 | 260 |
| New York City-Broadway | 229 | 221 |
| San Francisco | 226 | 229 |
| Miami | 225 | 222 |
| Denver | 212 | 209 |
| Detroit | 207 | 216 |
| Los Angeles | 195 | 202 |
| El Paso | 181 | 176 |
| Non-DD Court | 205 | 232 |
Many Families Have Not Found Representation
Thus far, only 43 percent of all cases assigned to the Dedicated Docket have found representation. Representation rates rise when families have longer to locate representation. For those assigned during FY 2021, 58 percent found representation by the end of FY 2022. Representation rates decline for families assigned during each succeeding three-month assignment period. For cases added to the Dedicated Docket between October and December 2021, 47 percent found attorneys. This percent then drops to 38 percent for cases assigned between January and March of 2022), drops again to 25 percent for cases assigned between April and June 2022, and drops again to only 6 percent for cases assigned last quarter between July and September of 2022. See Table 6.
There is also considerable variation in representation rates across the twelve DD cities. San Diego has the highest rate (77%) and Miami has the lowest (22%).
| All DD Cases | FY 2021 | Oct-Dec 2021 | Jan-Mar 2022 | Apr-Jun 2022 | Jul-Sep 2022 | |||||||
|---|---|---|---|---|---|---|---|---|---|---|---|---|
| All | Represented | All | Represented | All | Represented | All | Represented | All | Represented | All | Represented | |
| All | 110,708 | 43% | 33,149 | 58% | 37,905 | 47% | 22,415 | 38% | 5,765 | 25% | 11,474 | 6% |
| San Diego | 944 | 77% | 360 | 82% | 249 | 88% | 140 | 78% | 97 | 74% | 98 | 32% |
| New York City-Broadway | 6,555 | 56% | 902 | 74% | 2,098 | 68% | 2,359 | 59% | 278 | 30% | 918 | 10% |
| New York City | 10,847 | 52% | 6,292 | 65% | 2,199 | 48% | 773 | 43% | 560 | 28% | 1,023 | 2% |
| San Francisco | 5,753 | 52% | 1,530 | 60% | 1,866 | 65% | 918 | 59% | 538 | 40% | 901 | 10% |
| Seattle | 2,254 | 51% | 772 | 66% | 576 | 47% | 420 | 58% | 144 | 40% | 342 | 23% |
| Boston | 20,282 | 51% | 6,992 | 65% | 7,633 | 59% | 1,968 | 52% | 590 | 22% | 3,099 | 3% |
| Los Angeles | 6,268 | 45% | 1,808 | 63% | 2,068 | 48% | 878 | 49% | 412 | 30% | 1,102 | 10% |
| Detroit | 778 | 43% | 205 | 42% | 228 | 54% | 90 | 77% | 93 | 56% | 162 | 2% |
| Newark | 16,365 | 42% | 5,513 | 55% | 4,918 | 51% | 3,003 | 38% | 840 | 15% | 2,091 | 4% |
| El Paso | 398 | 31% | 103 | 45% | 126 | 31% | 69 | 41% | 34 | 26% | 66 | 0% |
| Denver | 2,710 | 28% | 848 | 35% | 733 | 21% | 452 | 41% | 372 | 28% | 305 | 5% |
| Miami | 14,723 | 22% | 3,083 | 32% | 6,986 | 19% | 3,758 | 23% | 346 | 24% | 550 | 2% |
| Non-DD Court | 22,831 | 40% | 4,741 | 56% | 8,225 | 48% | 7,587 | 28% | 1,461 | 13% | 817 | 7% |
Cases Move Faster Without an Attorney
Without attorneys to help guide their cases, families without representation tend to move more quickly through the asylum system. For all cases closed as of the end of September 2022, only one third (34%) were represented. Representation rates among only closed cases again varied by DD city with San Diego having the highest rates with three quarters (78%) represented, while Miami had the lowest rates at just 11 percent. Denver was next to the bottom with less than a quarter (21%) represented. See Table 7.
A number of closures occurred at the first scheduled hearing when the Immigration Judge dismissed the case because the DHS had failed to file the NTA with the Court – a necessary step in order for the Court to have jurisdiction to hear the case. When these closures are set aside, about half (52%) of the remaining closed cases were represented.
Although requested, neither EOIR nor DHS has released information on what has happened to these families when their case was dismissed. The government could issue a new NTA when the first NTA is closed for failure to prosecute.[12]. Or, ICE could deport them at any point in the absence of a pending Court case. Indeed, because families assigned to the Dedicated Docket according to the government are also being closely monitored by ICE's Alternatives to Detention program, they could be taken into custody at any time.
As has been well documented time and again through many programs, lacking representation few families on the DD were able to complete the necessary paperwork to formally file their asylum application before their case closed. Thus, they never had an asylum claim adjudicated on its merits. To be on the Dedicated Docket in the first place, families were screened and presumably not ineligible for asylum. Thus, the lack of an asylum claim is not due to the family failing to meet the eligibility for filing an application, but because they could not complete the paperwork.
Accordingly, in at least two-thirds of the cases no real hearing on the families’ asylum claims took place. See Table 8. (If cases dismissed because of DHS failed to file the NTA with the Court, the filed asylum applications represent 51 percent of remaining closed cases.)
Comparing representation rates for each DD hearing location with the respective proportion filing asylum applications, the two percentages closely resemble each other. See earlier Table 7. This clearly documents as a practical matter the overriding need for the assistance of an immigration attorney in order to successfully prepare and file an asylum application.
| All Closures as of September 30, 2022 | ||||
|---|---|---|---|---|
| Actual | Adjusted* | |||
| Percentage Represented | Percent Filed Asylum Application | Percentage Represented | Percent Filed Asylum Application | |
| All Dedicated Docket Cases | 34% | 33% | 52% | 51% |
| DD Hearing Locations: | ||||
| San Diego | 78% | 75% | 82% | 80% |
| Seattle | 55% | 68% | 57% | 70% |
| New York City-Broadway | 54% | 55% | 58% | 59% |
| San Francisco | 53% | 56% | 59% | 63% |
| New York City | 48% | 45% | 64% | 61% |
| Los Angeles | 43% | 40% | 61% | 57% |
| Newark | 35% | 30% | 39% | 33% |
| Detroit | 34% | 43% | 35% | 43% |
| El Paso | 30% | 35% | 45% | 53% |
| Boston | 26% | 22% | 46% | 39% |
| Denver | 21% | 29% | 28% | 38% |
| Miami | 11% | 12% | 39% | 41% |
| Non-DD Courts | 46% | 43% | 48% | 45% |
| Asylum Application Filed | Representation | Total | |
|---|---|---|---|
| Yes | No | ||
| Yes | 11,351 | 1,524 | 12,875 |
| No | 1,781 | 24,531 | 26,312 |
| Total | 13,132 | 26,055 | 39,187 |
| Percent Filed | 86% | 6% | 33% |
Only 7 Percent of Families Assigned to the Dedicated Docket Won Asylum
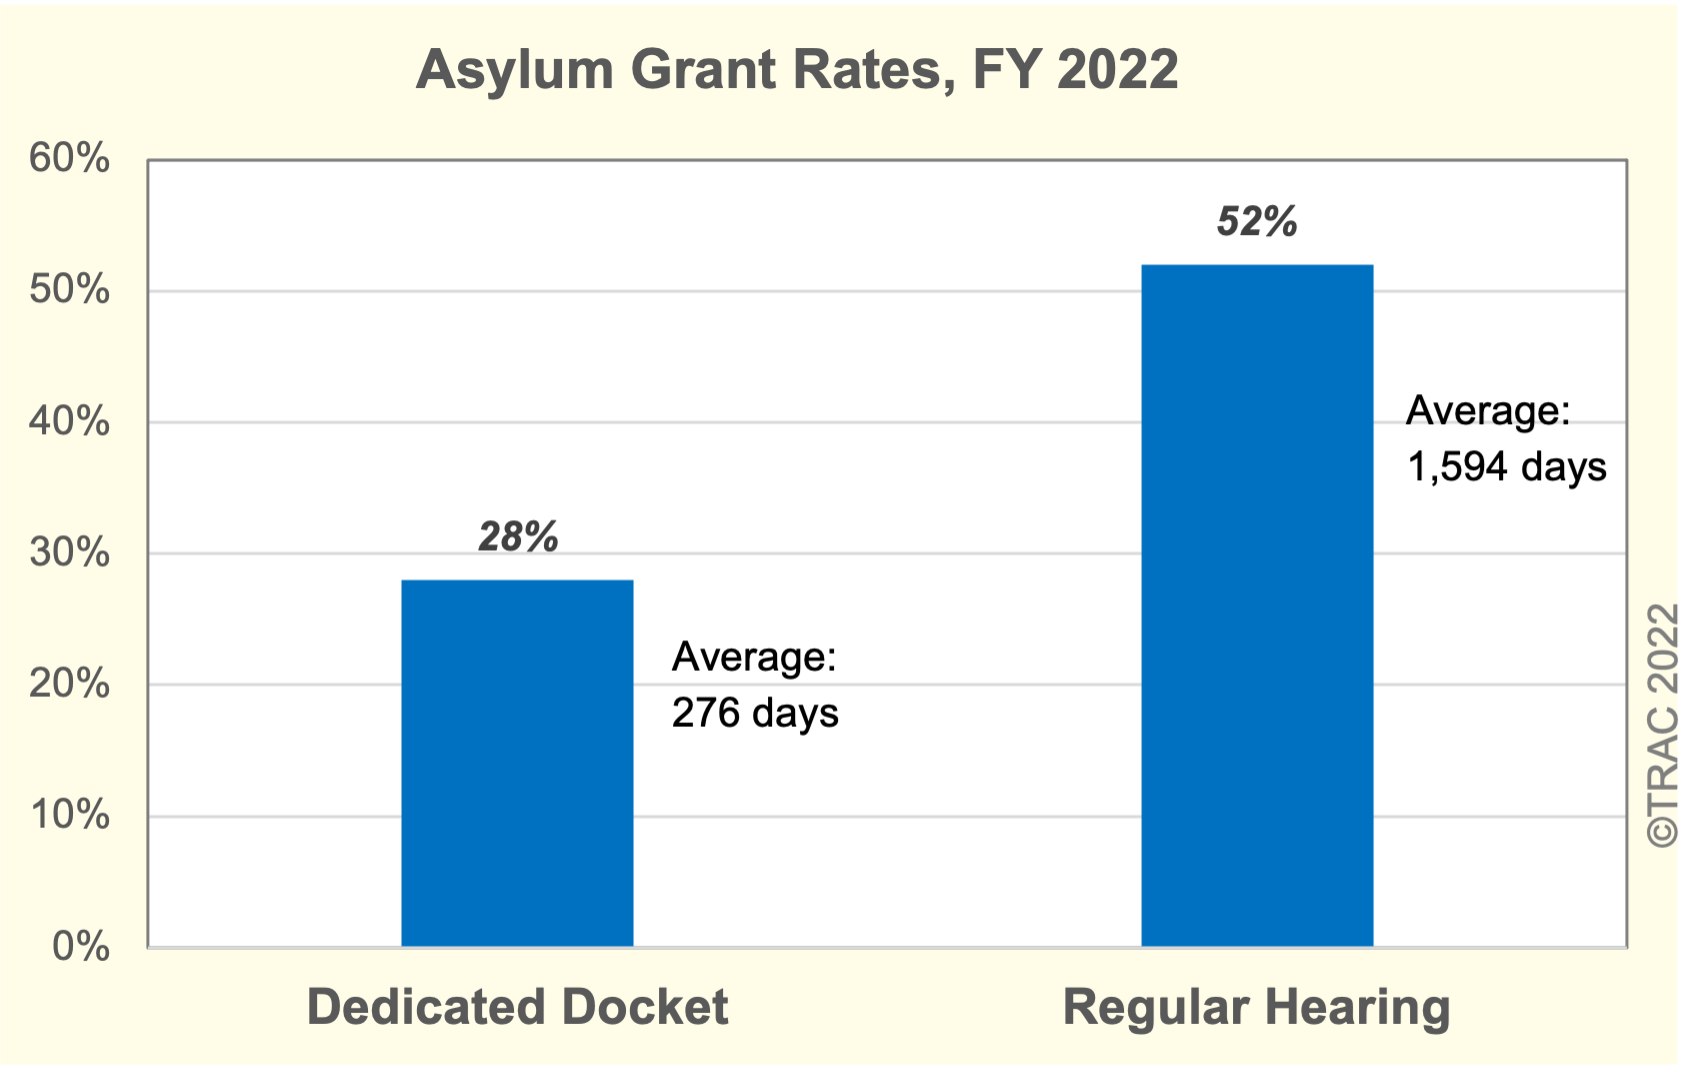
Very few families who were able to file a formal application for asylum with the Immigration Court received asylum. Of those families who filed applications, a total of just 10,301 had a full asylum hearing with a decision on the merits to either grant or deny their asylum claims.[13]. Of these, just 2,894, or 28 percent of families were granted asylum. This compares with 52 percent granted asylum in regular proceedings during FY 2022. See Figure 4.[14].
Compared with the total cases that have been decided so far, and given the many additional barriers along the way that eliminated cases before they got to this final stage, another way to look at this is that the 2,894 individuals awarded asylum represented a mere 7 percent of the 39,187 cases closed thus far on the Dedicated Docket. See earlier Figure 1.
There was considerable variation in grant rates. As TRAC previously reported, asylum grant rates varied widely depending upon which Immigration Judge decided the case. The range includes a judge in Miami who only granted asylum to 3 percent of individuals appearing before him on the Dedicated Docket, to a grant rate of 53 percent on the opposite coast when the case was assigned to a judge in the Los Angeles Dedicated Docket.[15]
Asylum grant rates also varied widely across the twelve Dedicated Docket courts. The highest grant rate was at the El Paso Dedicated Docket. Here two-thirds (68%) were granted asylum, although only 65 cases in total had been decided as of the end of September 2022. The San Francisco DD Court granted asylum in 48 percent of its cases, while the Boston DD Court was in third place with a 41 percent asylum grant rate. See Table 9.
At the other extreme was the Detroit DD Court which thus far granted asylum only 13 percent of the time, and the Miami and Seattle DD Courts which has granted asylum just 15 percent of the time.
| Hearing Locations | All Decisions* | Grant Asylum | Percent Granted |
|---|---|---|---|
| All | 10,301 | 2,894 | 28% |
| El Paso | 65 | 44 | 68% |
| San Francisco | 1,206 | 577 | 48% |
| Boston | 671 | 276 | 41% |
| San Diego | 156 | 47 | 30% |
| New York City-Broadway | 1,045 | 312 | 30% |
| Newark | 880 | 239 | 27% |
| New York City | 2,247 | 547 | 24% |
| Denver | 340 | 73 | 21% |
| Los Angeles | 1,355 | 270 | 20% |
| Miami | 885 | 136 | 15% |
| Seattle | 667 | 97 | 15% |
| Detroit | 114 | 15 | 13% |
| Non-DD Court | 670 | 261 | 39% |
In making comparisons, it is important to recognize that the makeup of DD cases in different cities, as well as compared with non-DD cases, aren’t necessarily the same. However, all the evidence suggests that grant rates were generally much lower for families who were heard on an expedited hearing schedule.
For example, the three countries with the largest number of asylum decisions during FY 2022 – El Salvador, Guatemala, and Honduras -- had sharply lower asylum grant rates when they were assigned to the Dedicated Docket.[16] Individuals from El Salvador had just half the asylum grant rate (only 18%) for families appearing on the Dedicated Docket as compared with those heard in regular proceedings where the grant rate was 36 percent. For Guatemala and Honduras, their asylum grant rates on the Dedicated Docket were each also only 18 percent. However, for those heard in regular proceedings during the same period, the grant rates were 32 percent and 29 percent, respectively. See Table 10.
| Nationality | DD Asylum Decisions | Regular Asylum Decisions | ||||
|---|---|---|---|---|---|---|
| All* | Grant | % Grant | All* | Grant | % Grant | |
| El Salvador | 1,102 | 202 | 18% | 6,574 | 2,353 | 36% |
| Guatemala | 1,244 | 228 | 18% | 6,022 | 1,948 | 32% |
| Honduras | 1,182 | 215 | 18% | 5,067 | 1,467 | 29% |
Conclusion
Thus far, the United States has implemented initiatives to make asylum cases fast, but not necessarily fair. Careful and independent continuing monitoring of this administration’s growing initiatives to expedite asylum cases is called for. Only in this way will the public have the information it needs to judge whether these initiatives live up to their goals and the claims being made as to their “success.”