ICE Apprehensions Half Levels of Five Years Ago
While Immigration and Customs Enforcement (ICE) administrative arrests are up as compared to the last two years of the Obama Administration, these "interior" apprehensions are only half the levels of five years ago when Secure Communities held sway under President Obama. Available arrest-by-arrest records indicate that ICE arrests under President Trump—after an initial jump—also appear to have stabilized and are no longer increasing. See Figure 1.
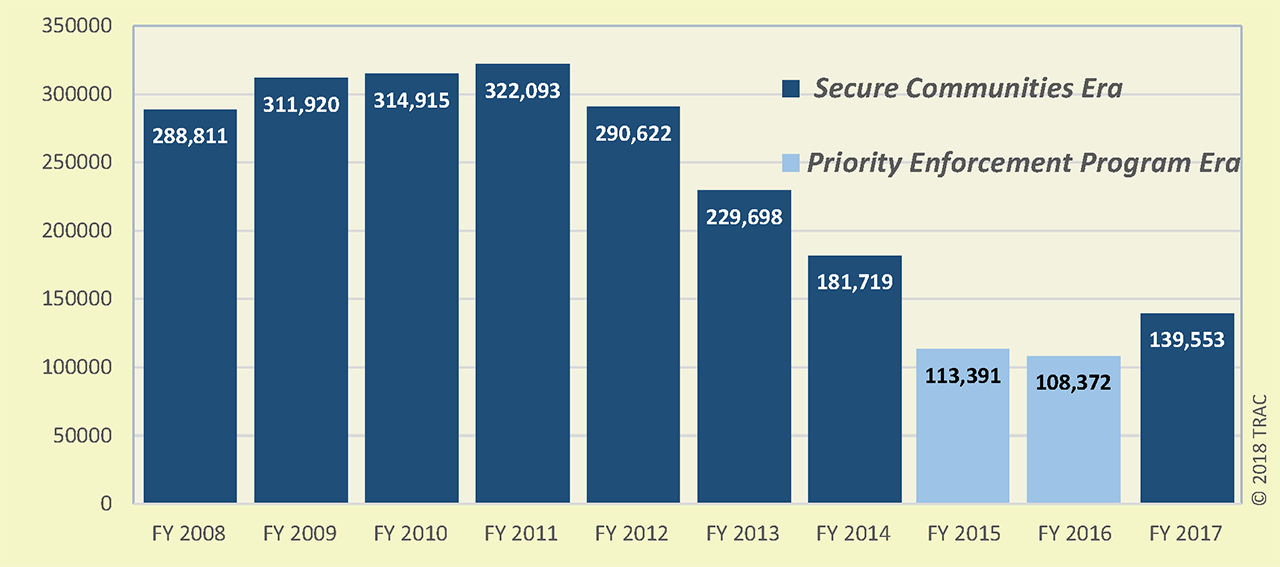
Figure 1. ICE Administrative (Interior) Arrests, FY 2008 - FY 2017
(Click for larger image)
As TRAC reported earlier[1], these trends on ICE apprehensions are similar to trends for other ICE immigration enforcement actions including its use of detainers, deportations under Secure Communities, as well as overall ICE deportations. Each remain well below the levels that prevailed during most of the Obama years.
Focusing just on monthly ICE arrests since President Trump assumed office, ICE arrests have averaged 13,318 per month during February - September 2017. This does represent a significant increase over the period between FY 2015 and FY 2016 when the Obama Administration replaced Secure Communities with the more narrowly focused Priority Enforcement Program.
However, ICE arrests are currently still way below those during the Secure Communities era under President Obama. Then ICE monthly arrests averaged 25,473 during the FY 2008 - FY 2012 period, and remained higher than current levels under President Trump throughout FY 2013 - FY 2014 even after ICE apprehension numbers began to drop. See Tables 1a and 1b.
|
Table 1a
|
Table 1b
|
Examining How ICE Arrests Take Place
Recently obtained internal ICE arrest-by-arrest records allow a detailed look at how these ICE arrests take place. In more than seven out of every ten ICE apprehensions, ICE assumed custody of individuals held by another law enforcement agency[2]. In this report these are referred to as "custodial" arrests. The remainder of the arrests usually take place somewhere in the wider community. These occur, for example, when ICE arrests someone from their home, workplace, business, courthouse, or some other location in the wider community[3].
These data obtained and analyzed by the Transactional Records Access Clearinghouse (TRAC) at Syracuse University reveal that the number of ICE "custodial arrests" are little changed from levels in October 2014 at the end of the Secure Communities era under President Obama[4]. Despite this administration's concerted efforts to push for greater assistance by state and local law enforcement agencies, as yet these efforts appear to have had little impact on the number of individuals ICE takes into custody from other law enforcement agencies.
October 2014 - September 2017
| 287(g) Program | Criminal Alien Program | CAP plus 287(g) | ||||||||
|---|---|---|---|---|---|---|---|---|---|---|
| Local | State | Federal | ||||||||
| Presidency and Year | Sept | Ave Feb-Sept | Sept | Ave Feb-Sept | Sept | Ave Feb-Sept | Sept | Ave Feb-Sept | Sept | Ave Feb-Sept |
| Obama (SC): 2014* | 661 | 661 | 5,556 | 5,556 | 968 | 968 | 2,194 | 2,194 | 9,379 | 9,379 |
| Obama (PEP): 2015 | 271 | 300 | 3,182 | 3,297 | 902 | 948 | 1,986 | 2,090 | 6,341 | 6,634 |
| Obama (PEP): 2016 | 331 | 280 | 3,275 | 3,133 | 881 | 889 | 1,677 | 1,841 | 6,164 | 6,143 |
| Trump (SC): 2017 | 627 | 696 | 5,752 | 5,554 | 823 | 878 | 1,888 | 1,842 | 9,090 | 8,970 |
| Trump (SC) vs Obama (SC) | -5% | 5% | 4% | 0% | -15% | -9% | -14% | -16% | -3% | -4% |
As shown in Table 2, this is true for each of ICE's various programs that pick up immigrants from local, state and federal law enforcement agencies, as well as for arrests through its 287(g) program where ICE officers are stationed in local jails. Overall, ICE monthly custodial arrests since President Trump assumed office are actually down slightly since October 2014 during the last month of Secure Communities under President Obama.
Community arrests, in contrast, are up. They rose from 2,893 in October 2014 to 3,360 in September 2017. See Table 3.
October 2014 - September 2017
| Custodial Setting* | Community Setting* | |||
| Presidency and Year | September | Ave Feb-Sept | September | Ave Feb-Sept |
| Obama (SC): 2014** | 9,925 | 9,925 | 2,893 | 2,893 |
| Obama (PEP): 2015 | 6,905 | 7,209 | 2,729 | 2,737 |
| Obama (PEP): 2016 | 6,853 | 6,710 | 2,682 | 2,659 |
| Trump (SC): 2017 | 9,718 | 9,517 | 3,360 | 3,801 |
| Trump (SC) vs Obama (SC) | -2% | -4% | 16% | 31% |
The Daily Pattern of ICE Custodial vs. Community Arrests
These arrest-by-arrest data allow a day-by-day comparison of ICE community versus custodial arrests. Figure 2 shows the pattern revealed for the three-year period covering FY 2015 - FY 2017. The weekly work cycle shows up as regular sharp valleys in the plots reflecting the greatly reduced number of apprehensions that take place over weekends as compared with weekdays. Similarly the holiday season each year around Christmas also shows a reduction in both custodial and community arrests[5].
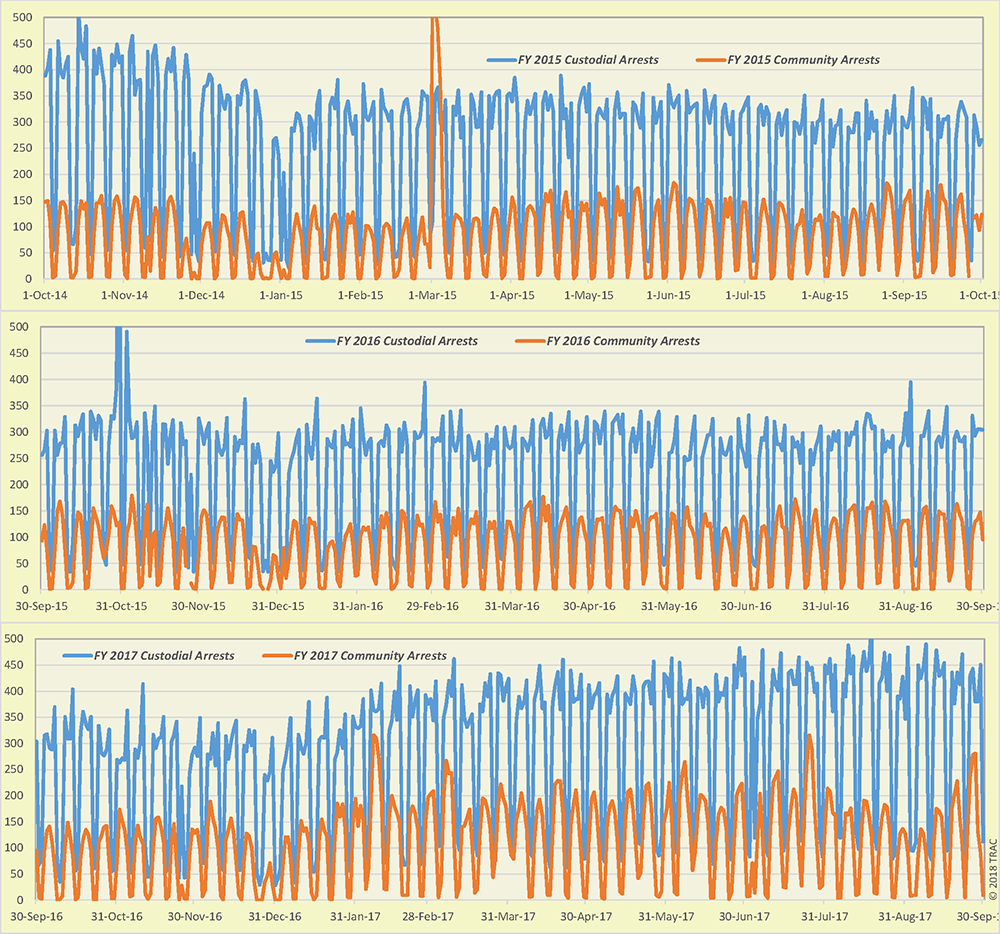
Figure 2. Daily ICE Custodial vs. Community Apprehensions, FY 2015 - FY 2017
(Click for larger image)
The more restrictive targeting when the Priority Enforcement Program (PEP) was implemented is evident. The weekly work cycle shows a reduction in custodial arrests that occurred when Secure Communities was abolished in November 2014. The drop is only apparent for custodial arrests. Community arrests, in contrast, continued at much the same level for the rest of President Obama's term.
After President Trump assumed office at the end of January 2017, the plot shows that custodial arrests immediately rose after the more restrictive priorities of PEP were abolished. The weekday arrest numbers returned to approximately the same level present during October 2014 - the last month of Secure Communities under President Obama.
After Trump assumed office, the number of community arrests also rose - this time to levels higher than during the Obama years when apprehension numbers had been fairly flat. However, through the end of FY 2017 under Trump there is little indication of large targeted raids or other special initiatives that might be expected to show up as usually sharp jumps in the daily arrest patterns[6]. The increase in community arrests appears more likely to largely reflect the change in ICE policy concerning so-called collateral encounters. New ICE policies now call for arresting anyone its agents happen to encounter in the community while searching for other individuals that were their targets.
Footnotes
[1] See TRAC's April 2018 report with comparisons on ICE's use of detainers, TRAC's April 2018 report on Secure Communities deportations, and its May 2018 report on overall removal trends.
[2] Many of these apprehensions occurred when ICE took individuals into custody from the prison or jail facility where they had been serving their sentence for a criminal conviction. Still others were transferred to ICE custody after they were picked up and fingerprinted by local law enforcement agencies on a non-immigration matter. This was coordinated through ICE's Criminal Alien Program (CAP). A few locales participate in ICE's 287(g) program where ICE agents are stationed within local jails.
[3] Numbers in this report use ICE's operational definition for community arrests found in its FY 2017 ICE Enforcement and Removal Operations Report. All other arrests are labeled for simplicity as custodial arrests although a small number come from a range of other sources other than CAP and 287(g) programs.
[4] These newly released internal records cover October 2014 through September 2017. Data for earlier time periods have not yet been released by ICE.
[5] See TRAC's earlier February 2017 report covering the arrest of individuals with outstanding removal orders for a further discussion of some of these daily patterns during the Obama years.
[6] More recently, ICE has started conducting raids. The latest reportedly resulted in 114 arrests on June 5, 2018. In January 2018 targeted 7_Eleven stores and arrested 21 and 97 were arrested in April 2018 when ICE raided a meatpacking plant.