Where Are Immigrants with Immigration Court Cases Being Detained?
Nearly two out of every three immigrants who have been detained during Immigration Court proceedings during the Bush, Obama, and Trump administrations were housed in just twenty-five counties out of the over three thousand counties in this country. This and other findings emerge from TRAC's newly expanded online tool which provides Immigration Court details based on the immigrant's address recorded in court records.

Among these top 25 counties, Texas tops the list with 200,719 detainees in total who were housed across 6 counties, followed by California with 165,367 detainees who have been held at facilities in 4 counties. Together these 10 counties in just two states accounted for three out of every 10 detained immigrants since FY 2001. These counts include only immigrants who were detained until the court proceedings on their case ended, and excludes detainees who were originally detained but then subsequently released[1].
Los Angeles County, California with its Mira Loma Detention Facility (and San Pedro) accounted for the largest number of detainees among all counties in the United States. It was followed by Stewart County, Georgia which has the Stewart Detention Center. In third place was El Paso County, Texas where the El Paso Service Processing Center is located.
The Northwest Detention Center placed Pierce County, Washington, where it is located the fourth highest county in the country housing detainees. This was closely followed by the Otay Mesa Detention Center that put San Diego County, California, in fifth place. For the list of all twenty-five counties and their rankings, see Table 1 at the end of this report.
Changing Detainee Patterns Over Time
The proportion detained during their Immigration Court proceedings has varied between a low of 11 percent to a high of 58 percent. Those who were never detained while their cases were pending in court also ranged widely from a high of 73 percent down to a low of 30 percent. As shown in Figure 1, once President Trump was inaugurated the proportion never detained fell sharply from 72 percent in December of 2016 to 47 percent in February 2017, while those detained jumped up.
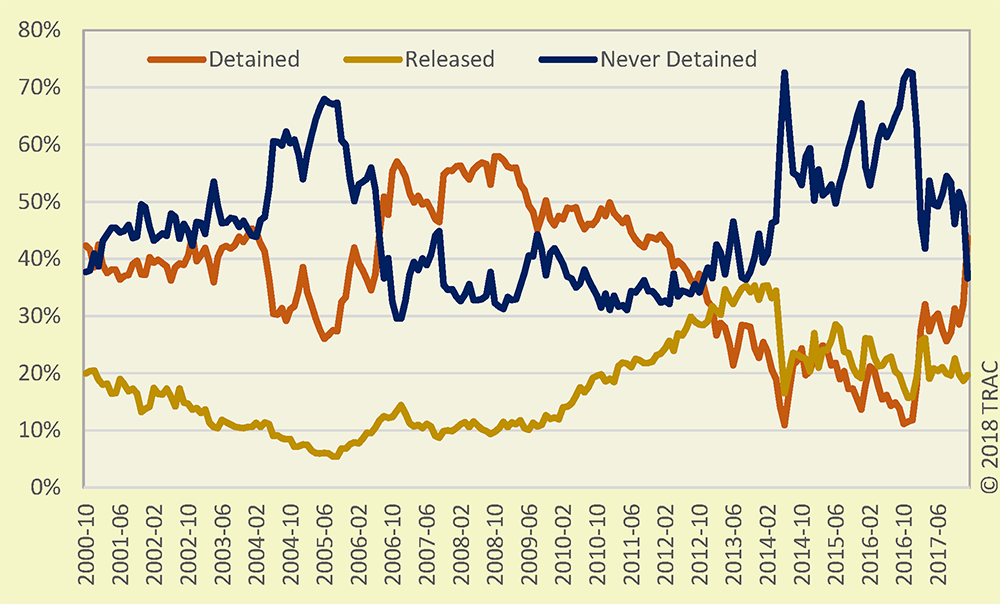
Figure 1. Changing Percent Detained, Released and Never Detained in Immigration Court Proceedings,
October 2000 - January 2018
(Click for larger image)
The line-up of counties housing the most detainees has also undergone change during the Bush, Obama and Trump presidencies. By FY 2017 Los Angeles County had slid to 77th place in terms of the number of immigrants that county housed in detention facilities in court proceedings.
Ranked first in FY 2017 was Stewart County, Georgia (Stewart Detention Center), followed in second place by Pinal County, Arizona (Eloy Detention Center). Pierce County, Washington (Northwest Detention Center) had climbed to third place in these rankings last year.
The LaSalle Parish in Louisiana with its LaSalle Detention Facility had risen to fourth place by FY 2017. And a county which hadn't made the original top 25 list climbed to fifth place: Montgomery County, Texas with its Joe Corley Detention Facility.
How the detained population has varied county by county can be viewed by going to the app providing "Details on Deportation Proceedings in Immigration Court."
October 2000 - February 2018
| Rank | County | State | Court Hearing Location | Number |
|---|---|---|---|---|
| 1 | Los Angeles County | California | Mira Loma Detention Facility and San Pedro | 59,587 |
| 2 | Stewart County | Georgia | Stewart Detention Center | 55,069 |
| 3 | El Paso County | Texas | El Paso Service Processing Center | 54,726 |
| 4 | Pierce County | Washington | Northwest Detention Center | 46,503 |
| 5 | San Diego County | California | Otay Mesa Detention Center and San Diego Federal Bldg. | 44,261 |
| 6 | Harris County | Texas | Houston Service Processing Center | 42,707 |
| 7 | Pinal County | Arizona | Eloy INS Detention Center and Florence | 39,276 |
| 8 | Cook County | Illinois | Chicago Detained | 37,874 |
| 9 | Imperial County | California | El Centro, California | 36,857 |
| 10 | Cameron County | Texas | Port Isabel Service Processing Center | 34,128 |
| 11 | York County | Pennsylvania | York County Prison | 29,545 |
| 12 | Miami-Dade County | Florida | Krome North Service Processing Center | 27,713 |
| 13 | LaSalle Parish | Louisiana | LaSalle Detention Facility | 25,282 |
| 14 | Frio County | Texas | Pearsall Detention Facility | 25,156 |
| 15 | San Francisco County | California | San Francisco Detained | 24,662 |
| 16 | Broward County | Florida | Broward Transitional Center | 24,401 |
| 17 | Pima County | Arizona | Tucson Detained | 23,473 |
| 18 | Haskell County | Texas | Rolling Plains Detention Center and Houston Detained | 22,416 |
| 19 | Polk County | Texas | Polk County Detention Facility | 21,586 |
| 20 | Fulton County | Georgia | Atlanta Detained and Stewart Detention Center | 20,224 |
| 21 | Clark County | Nevada | Las Vegas Detained | 19,057 |
| 22 | Allen Parish | Louisiana | Oakdale | 18,890 |
| 23 | Platte County | Missouri | Kansas City Detained | 18,879 |
| 24 | Arapahoe County | Colorado | Denver Detention Facility | 18,085 |
| 25 | Adams County | Colorado | Denver Detention Facility | 17,573 |
Footnotes
[1] Because this data is based upon Immigration Court records, it also doesn't include those who ICE detained while agency officials decided their fate, bypassing the Immigration Court. Detention facility statistics for all individuals in ICE custody during FY 2015 are available at: http://trac.syr.edu/immigration/detention/exit.shtml and http://trac.syr.edu/immigration/detention/tran.shtml.